
Use cases · Jira dashboards
Sprint review dashboard in Jira: what to show and how to build it
Most sprint reviews run with the Sprint Report open in one tab, the burndown in another and a filter for "what's still open" in a third. Jira has every number the review needs — it just keeps them on the board, one report at a time, with no way to put the Sprint Report on a dashboard. Here is what a sprint review dashboard should answer, how far native gadgets get you, and a full-page layout that flips between sprints with one click.
Short answer. Jira Cloud cannot place the Sprint Report on a dashboard. The native
substitutes are the Sprint Burndown and Sprint Health gadgets plus a
Filter Results gadget on sprint in openSprints() — active sprint only, issue
counts rather than points, and a saved filter per sprint if you want to look back. A
Plugio Suite dashboard in sprint mode binds every widget to one sprint of a
board: committed vs. delivered tiles, a burnup with the sprint's scope line, work by person, epic
progress and the open-items list, and a sprint chip that moves the whole page to any past sprint.
Five questions a sprint review answers
- Did we deliver what we committed? Points or issues done against the sprint's total — the say-do ratio.
- How did the sprint unfold? Steady progress, or everything closed in the last two days.
- Where did the work go? Per person and per epic — who carried what, which initiative moved.
- What is still open? The carry-over list, with owners, ready to discuss.
- What changed mid-sprint? Work added or pulled after the start.
A dashboard that answers all five on one screen replaces the tab-switching; the setups below are grouped by those questions.
What Jira shows natively
- Sprint Report (board → Reports) — the most complete native answer: for any sprint, open or closed, the lists of completed, not completed, removed and added issues (added ones carry an asterisk), with the burndown on top. It answers questions 1, 4 and 5. It also lives only on that board's Reports page, cannot be embedded in a dashboard, and has no per-person or per-epic view.
- Burndown and Velocity charts — question 2 and the long-run view of question 1, again on the board only.
- Sprint Burndown gadget — the board's burndown chart inside a dashboard. One board, a chart, no numbers around it.
- Sprint Health gadget — the active sprint's issues by status category as a bar, days elapsed and a scope-change count. One board, active sprint only, fixed layout.
- Filter Results gadget on
sprint in openSprints() AND statusCategory != Done— the open list (question 4), as long as the review is of the current sprint. - Two Dimensional Filter Statistics and Pie Chart — issues by assignee × status or by epic. Counts only; no story points, no completion percentage.
Where these stop: every gadget is bound to a saved filter, so it either shows the active sprint
(openSprints()) or a sprint hard-coded by name (sprint = "Sprint 42"), one
filter per gadget per sprint. Statistics gadgets count issues rather than sum points. Nothing gives a
per-person completion ratio or an epic rollup limited to the sprint's issues, and there is no single
control that flips the whole dashboard to last sprint.
Which Plugio tool?
| If you want… | Use | Why |
|---|---|---|
| A full review page — headline numbers, burnup, work by person, epic progress and the open list — that follows one sprint switcher | Plugio Suite (sprint mode) (setup below) | Every widget is restricted to the chosen sprint; viewers flip to any past sprint; the finished page goes on a native dashboard as a gadget. |
| One gadget on an existing dashboard, with commitment measured at sprint start and mid-sprint additions shown apart | Sprint Health Monitor & Progress Bar | Reads the issue change history for the strict say-do reading; covered step by step in Say-do ratio on a Jira dashboard. |
| Just points by assignee × status as a table on a native dashboard | Multi-Dimensional Pivot Table | Covered in Sum story points by assignee and status. |
Setup — a sprint review dashboard in Plugio Suite
One dashboard, eight widgets, built once. The sprint chip does the rest at every review.
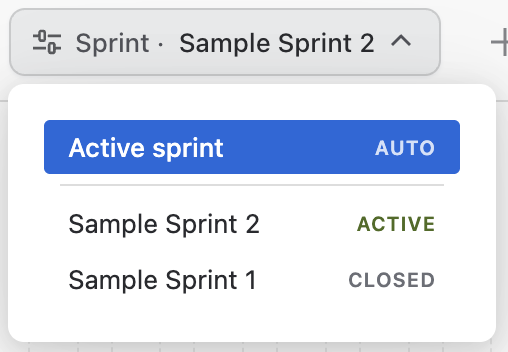
- Create the dashboard and bind it to the board. In Plugio Suite, add a dashboard, open Set scope, choose Sprint based and pick the scrum board. Leave the selection on Active sprint: the dashboard rolls over by itself when a new sprint starts, and the period picker becomes a sprint chip. Every widget you add from here on reads only the sprint's issues.
- Headline numbers (question 1). Add a Number widget with three value rows:
Committed Sum of Story Points Delivered Sum of Story Points where statusCategory = Done Completion {Delivered} / {Committed} * 100 ← the displayed rowGive the formula a "%" suffix and turn on Compare to previous period — on a sprint dashboard the badge compares with the previous sprint. Add colour bands (below 70 red, 70–90 amber, 90 and above green). Two more Number tiles showing Committed and Delivered on their own complete the row. The definition question behind these figures is discussed in the say-do ratio guide.
- Burnup with scope line (question 2). Add a Line widget: value Sum of Story Points, X axis Resolved, bucket Day, then tick Cumulative (running total) and Show total scope line. The curve is delivered points day by day across the sprint's dates; the dashed line is the sprint's total. A curve that climbs steadily and one that jumps on the last day tell very different review stories.
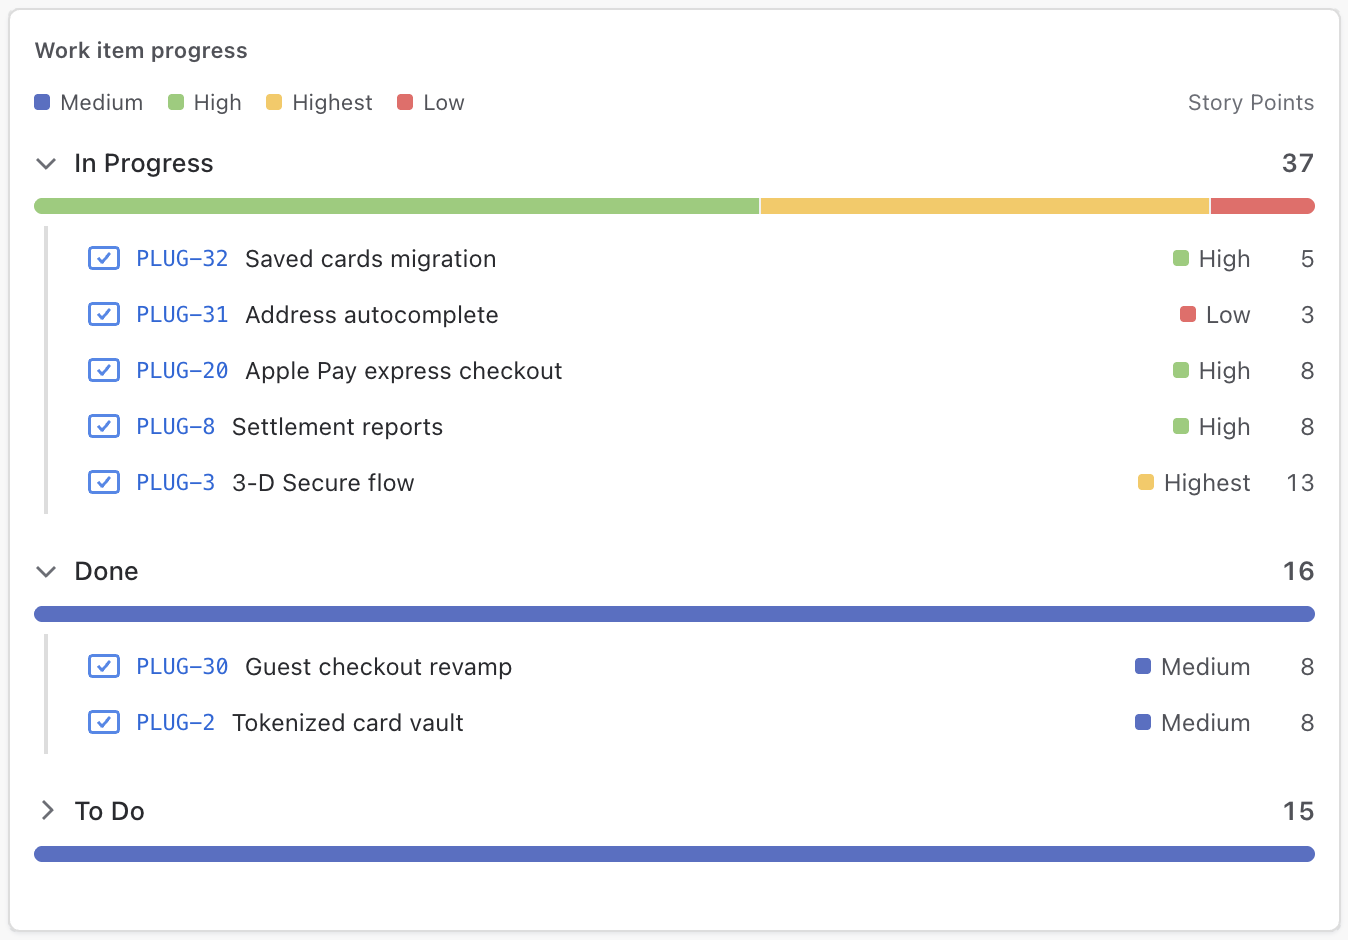
- Work by person (question 3). Add a Breakdown widget: value Sum of Story Points (or Count), rows Assignee, split by Status category. Each row is one person with a Done / In Progress / To Do bar in Jira's colours and a % complete figure; clicking a row lists the issues behind it. Prefer a chart? A Grouped / Stacked Bar with X axis Assignee and Stack by Status category shows the same split.
- Epic progress inside the sprint (question 3). Add a Hierarchy widget. On a sprint dashboard the tree is built from the sprint's issues, so each epic row shows only its work in this sprint, with the default Progress column (status split and % done) rolled up over the branch. Set Roll up from to match how the team estimates: Lowest level when sub-tasks carry points, Stories & tasks when they are a checklist.
- Still open (question 4). Add a List widget with the extra filter
statusCategory != Done, columns Summary, Assignee, Status and Story Points, ranked by Priority, highest first, max rows 15. Rows open the issue in Jira, so the carry-over conversation happens straight from the dashboard. - A one-line verdict. Add a Text widget with the same three value rows plus a fourth,
Goal = {Committed} * 0.9, and the body{if {Delivered} >= {Goal}}On track — {Delivered} of {Committed} points delivered.{else}Behind — {Delivered} of {Committed} points delivered.{end}The sentence updates with the data and with the sprint chip. - Save and share. Set the dashboard to Shared. Viewers get the sprint chip and any filters you marked Editable (make Assignee editable so a lead can narrow the page to one person during the review). To keep it where the team already looks, add the Plugio Suite Dashboard gadget to a native Jira dashboard and pick this one.
Reviewing a closed sprint
Open the sprint chip and pick the sprint that just ended: every widget follows, and the Number badge now compares that sprint with the one before it. Nothing is saved when a viewer does this; Reset returns to the active sprint. For a permanent retrospective page, pin the sprint in the scope dialog instead.
Two things to know before quoting the numbers:
- Suite reads the sprint as Jira reports it now. An issue added mid-sprint is part of Committed; an issue removed is gone from both sides. If your retrospective insists on the commitment at sprint start, put the Sprint Health Monitor gadget next to the Suite gadget on the same native dashboard — it draws mid-sprint additions apart, and the gap between the two figures is your scope change (question 5). The native Sprint Report's asterisked list remains the authoritative record.
- Status is current, not frozen at sprint close. An issue carried over and finished in the next sprint shows as Done under the old sprint too. Review promptly, or read a closed sprint's page as "what happened to that sprint's work", which is often the better retrospective question.
Variations
Several teams
A Suite dashboard is bound to one board. Build one per team and place their gadgets on one native Jira dashboard, or use the Sprint Health Monitor's comparison layout for up to four boards in a single gadget.
Issue count or hours instead of points
Replace Sum of Story Points with Count or Sum of Original estimate in every value row; the burnup, breakdown and hierarchy accept the same change. Time fields format as durations automatically.
Kanban teams
No sprints, so choose a Date based scope on the project, set the period to the review cadence (Last 2 weeks, or a custom range) and Period applies to Resolved. The same widgets then read "work resolved in the period"; the burnup keeps its cumulative curve but has no scope line, because there is no sprint total to draw.
Team-managed projects
Team-managed projects estimate in Story point estimate, not Story points. Use that field in every value row.
Sprint Report vs. native gadgets vs. Suite
| Sprint Report (native) | Native dashboard gadgets | Plugio Suite (sprint mode) | |
|---|---|---|---|
| Where | Board reports page | Native Jira dashboard | Full-page dashboard, or a native gadget |
| Sprint selection | Dropdown, any sprint | Active sprint via openSprints(), or a saved filter per sprint |
Sprint chip on the whole page; active by default, any past sprint on demand |
| Points, not just counts | Totals per list | Counts only in statistics gadgets | Sum, average and formulas over any numeric field |
| By person / by epic | No | Counts by assignee or epic | Breakdown with % complete per person; Hierarchy with rolled-up epic progress |
| Added / removed mid-sprint | Yes, listed | Scope-change count in Sprint Health gadget | No (sprint as it is now); pair with Sprint Health Monitor |
| Cost | Included | Included | Free on the Marketplace |
Build the review page once. Plugio Suite is free on the Atlassian Marketplace; the documentation covers sprint mode, the burnup scope line and the Hierarchy widget, and the live demo runs on sample data.
Need the commitment-at-start figure as a single gadget? Sprint Health Monitor & Progress Bar — also free.
Frequently asked questions
Can I put the Jira Sprint Report on a dashboard?
No. It lives on the board's Reports page. On a dashboard the closest native pieces are the Sprint Burndown gadget, the Sprint Health gadget and a Filter Results gadget on sprint in openSprints(). A Plugio Suite sprint dashboard rebuilds the report's content as widgets and can be placed on a native dashboard as a gadget.
Does the dashboard move to the next sprint automatically?
Yes when the scope is left on Active sprint — every widget follows the board's current sprint. Pin a specific sprint instead if the page is a retrospective for that one sprint.
Can I review a sprint that has already closed?
Yes. The sprint chip lists the board's past sprints; picking one moves every widget to it and the previous-sprint badge compares it with the sprint before. Statuses are read as they are now, so carried-over work that has since finished shows as Done.
Does it show work added or removed mid-sprint?
Suite reads the sprint as it is now, so additions count as committed and removals disappear. The native Sprint Report lists both; the Sprint Health Monitor gadget shows mid-sprint additions as separate segments and keeps them out of the committed base.
Can stakeholders who never open the board see it?
Yes. Set the dashboard to Shared and send the link, or place it on a native Jira dashboard as a gadget. Every query runs with the viewer's own Jira permissions, so they need browse access to the project, nothing more.
Does this work for Kanban boards?
Use a date-based scope with the period anchored to Resolved and set to the review cadence. All widgets except the scope line work the same way.