
Use cases · Jira dashboards
Show sprint progress on a Jira dashboard
You want one glance at a Jira dashboard to answer "how far along is the sprint?" — as a bar or a dial, in story points rather than ticket counts, against what the team actually committed. Here is what Jira does natively, and how to set it up as a live gauge or progress bar.
Short answer. Jira's stock Sprint Health and Sprint Burndown
gadgets show progress for one board's active sprint in a fixed format. To show sprint progress as a
progress bar, gauge or percentage on any dashboard — by story points, time estimate or issue count,
across one board or several — use a gauge gadget whose value is Sum of Story Points over
done issues in openSprints() and whose maximum is the sum over all issues in the sprint.
Both ends update live, so the gadget never needs re-editing when a new sprint starts.
What Jira shows natively
Jira Cloud has two dashboard gadgets for this, and both are bound to a single board:
- Sprint Health — a bar of issues by status category for the board's active sprint, with time elapsed and scope change. It uses the board's estimation statistic, and its layout is fixed.
- Sprint Burndown — the board's burndown chart embedded in the dashboard. Accurate, but a chart, not a headline number.
Where these stop: you can't put a single percentage on the page, can't combine several teams' sprints into one figure, can't colour the result against a threshold, and can't measure progress by a field the board doesn't estimate in (time, a custom "effort" number). The board view itself has the same information, which is partly why the gadgets exist at all.
Which Plugio gadget?
Several Plugio gadgets can draw sprint progress; they differ in how much they say around the bar:
| If you want… | Use | Why |
|---|---|---|
| One bar, dial or percentage — "how far", in any unit, for one team or several | Gauge Chart, Progress Bars & Counters (the setup below) | Value, Min, Max and markers are each a fixed number or a live JQL; three visualizations from one configuration. |
| "Are we on pace, and did scope change?" | Sprint Health & Capacity Tracker | Battery-style gauge with expected-vs-actual pace and scope added mid-sprint — the opinionated version of the same question. |
| The progress bar as one tile among KPI cards, donuts and sparklines on one period | Report Cards & Charts (Progress card) | A progress bar toward a fixed or JQL-driven target inside a grid of other card types. |
| A full-page sprint dashboard with a sprint picker every widget follows | Plugio Suite (Progress / Battery widgets) | Sprint mode: one sprint selection drives every widget, plus filters viewers can change. |
Set it up as a live progress bar
The gadget below is Gauge Chart, Progress Bars & Counters. Every number in it — the value, the minimum, the maximum and every target marker — can be a fixed number or a live JQL result, which is what makes a sprint gauge self-maintaining.
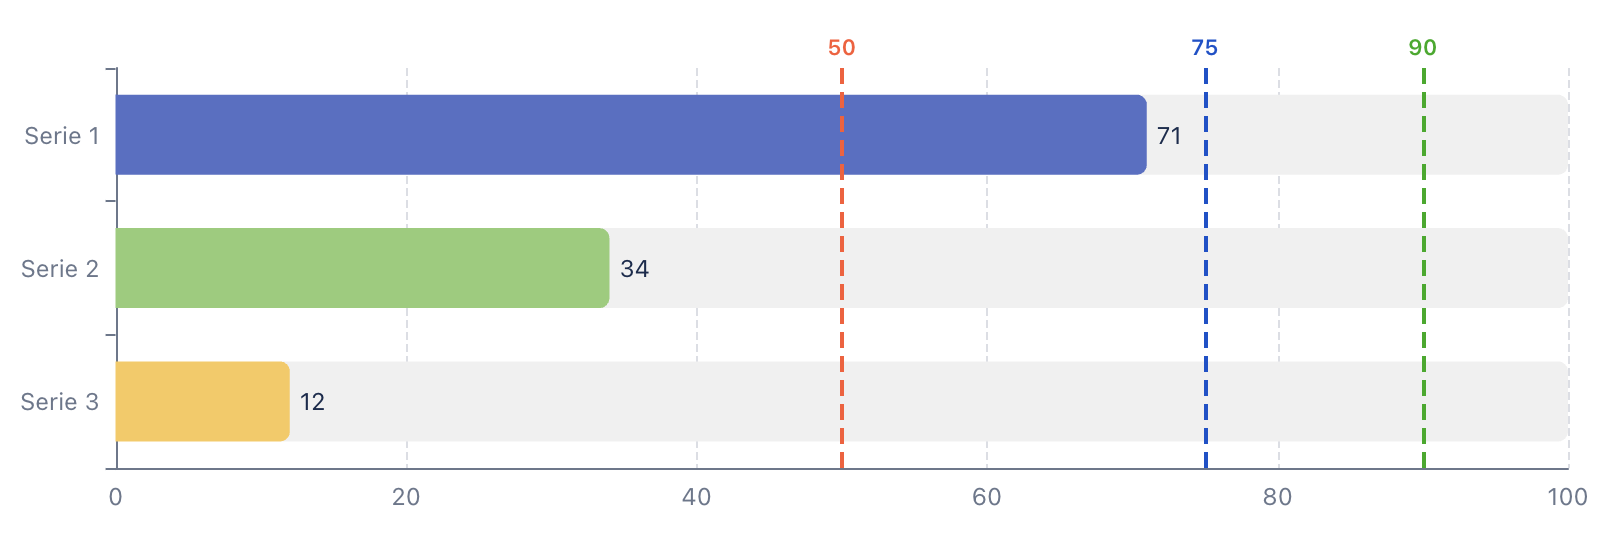
- Add the gadget to your dashboard (Add gadget → search "Gauge Chart") and open Configure. Pick Progress Bar in the floating switcher.
- Series 1 — the work that's done. Set the data source to JQL, metric to
Sum of Story Points:
project = ABC AND sprint in openSprints() AND statusCategory = DoneName the series "Done".
- Max Value — the sprint commitment. Switch Max from Fixed to JQL, same metric,
without the status clause:
project = ABC AND sprint in openSprints()Leave Min at 0. The bar now runs from zero to whatever the team committed, and re-reads both numbers on every dashboard load.
- Optional — a pace marker. Add a target marker (Markers panel) at the point the team should be at today. A fixed marker ("half the sprint, half the points") is the simple version; in practice most teams find the bare bar plus the commitment is enough.
- Save. The preview is the real widget, so what you see is what the dashboard renders.
Team-managed projects
Team-managed (next-gen) projects estimate in Story point estimate, not Story points. Pick that field in the metric dropdown — the JQL above is unchanged. If your dashboard mixes both project types, add one series per project type, each with its own field.
Variations
As a percentage
Use the gadget's Percentage analysis mode: Target = the done query, Total = the commitment query, Min 0 and Max 100. You get a whole-number percentage — 62, not 62% — which works well as a Counter card or a Gauge with a green band above 70.
Several teams on one dashboard
Add one series per board or project — project = ABC, project = XYZ — each in
percentage mode. The progress bar draws one bar per series on a shared 0–100 axis, so three teams'
sprint progress sits side by side with no board switching.
By time instead of points
Swap the metric to Sum of Original Estimate (done) and the same field for Max. Time fields are summed in seconds, which is fine for a ratio: the bar's shape is right even if the raw labels are large. For hours-and-days labels, the Number widget in Plugio Suite formats durations natively.
Scope creep, pacing and sprint health
A progress bar answers "how far". If the question is "are we on track, and did scope change?", Sprint Health & Capacity Tracker is built for exactly that: a battery-style gauge with expected-vs-actual pace and scope added mid-sprint — the same shape of gadget, one step more opinionated.
Native gadget vs. gauge gadget
| Sprint Health / Burndown gadget | Gauge / Progress Bar gadget | |
|---|---|---|
| Scope | One board's active sprint | Any JQL — one sprint, several projects, a filter |
| Unit | Issues, or the board's estimation field | Issue count or the sum of any numeric field |
| Display | Fixed status bar or burndown chart | Progress bar, radial gauge or counter cards; thresholds and target markers |
| Maintenance | None | None — Max is a live JQL, so it follows the sprint |
| Cost | Included | Free on the Marketplace |
Set it up in a few minutes. Gauge Chart, Progress Bars & Counters is free on the Atlassian Marketplace. The documentation covers every setting, including JQL-driven Min/Max and target markers.
Frequently asked questions
Can a Jira dashboard show sprint progress as a percentage?
Not with the stock gadgets — Sprint Health shows a status bar, not a single figure. A gauge gadget in percentage mode divides done story points by committed story points and shows the whole-number result on a 0–100 scale.
Does the gadget need to be edited when a new sprint starts?
No. Both the value and the maximum use sprint in openSprints(), so the moment a sprint is started the gadget reads the new commitment and the new done total. Nothing is cached between sprints.
What if a project has several boards with parallel sprints?
openSprints() matches every active sprint the issue is in. Narrow with sprint in openSprints() AND sprint = "Team A Sprint 12", or filter by a board-specific component or label, so each series maps to one sprint.
Does it count sub-task story points?
It sums whatever the JQL returns. Sub-tasks inherit their parent's sprint, so they are included if they carry estimates — add AND issuetype not in subTaskIssueTypes() to count parents only, and avoid double counting when both levels are estimated.
Who can see the numbers?
The gadget reads Jira as the person viewing the dashboard, through the Jira REST API. Everyone sees only the issues their own permissions allow; nothing is written to Jira and no data leaves your site.