
Jira dashboard use cases
One task per page: what Jira does natively, where it stops, and the exact setup to get the result with a Plugio gadget — JQL included.
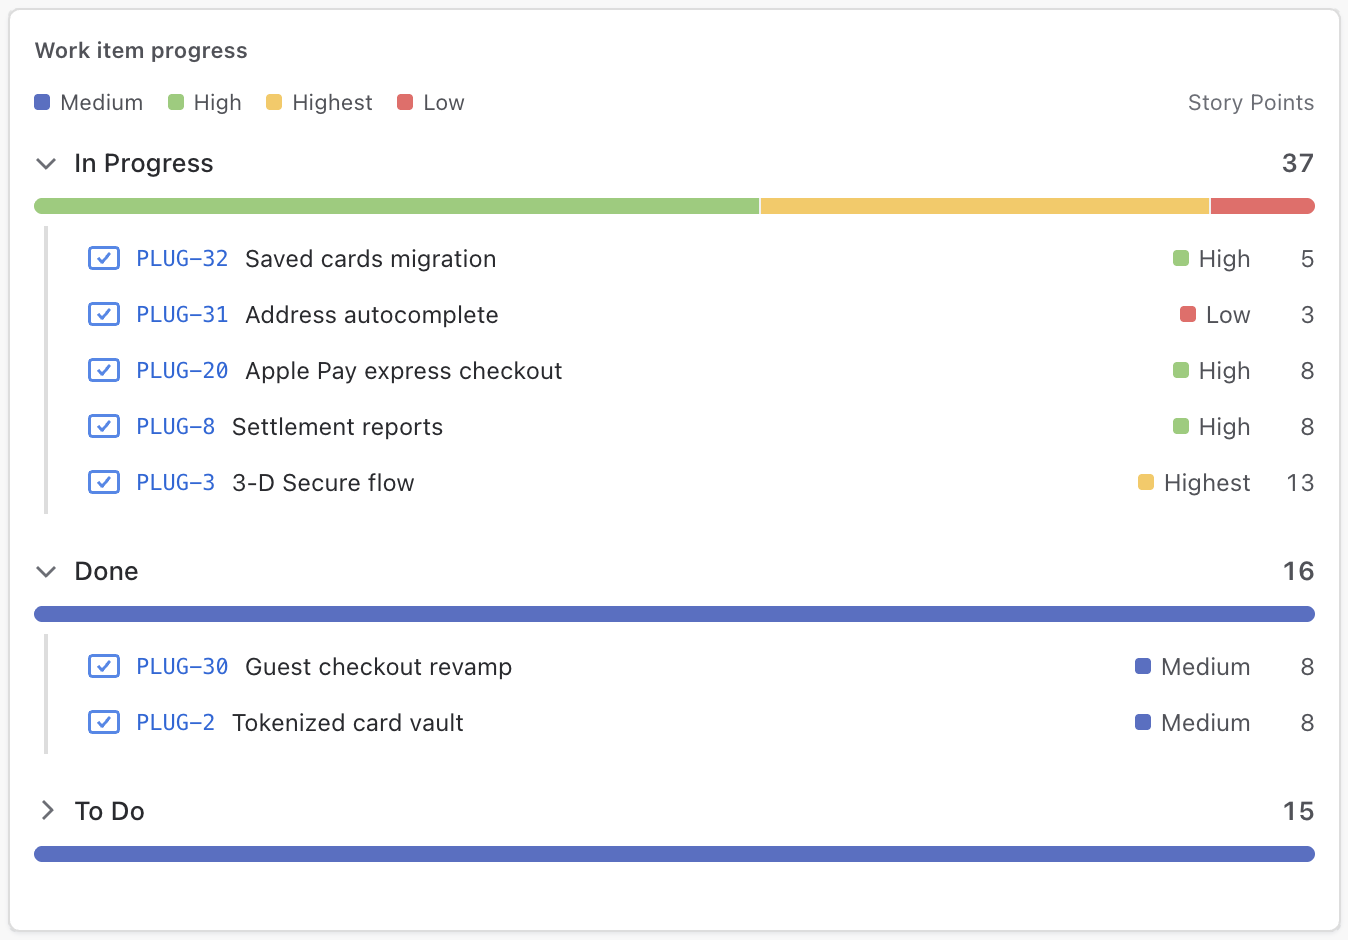
Sprint review dashboard in Jira: what to show and how to build it
The Sprint Report can't go on a dashboard. Committed vs. delivered, a burnup with the sprint's scope line, work by person, epic progress and the open list — on one sprint switcher that flips to any past sprint.
Read the guide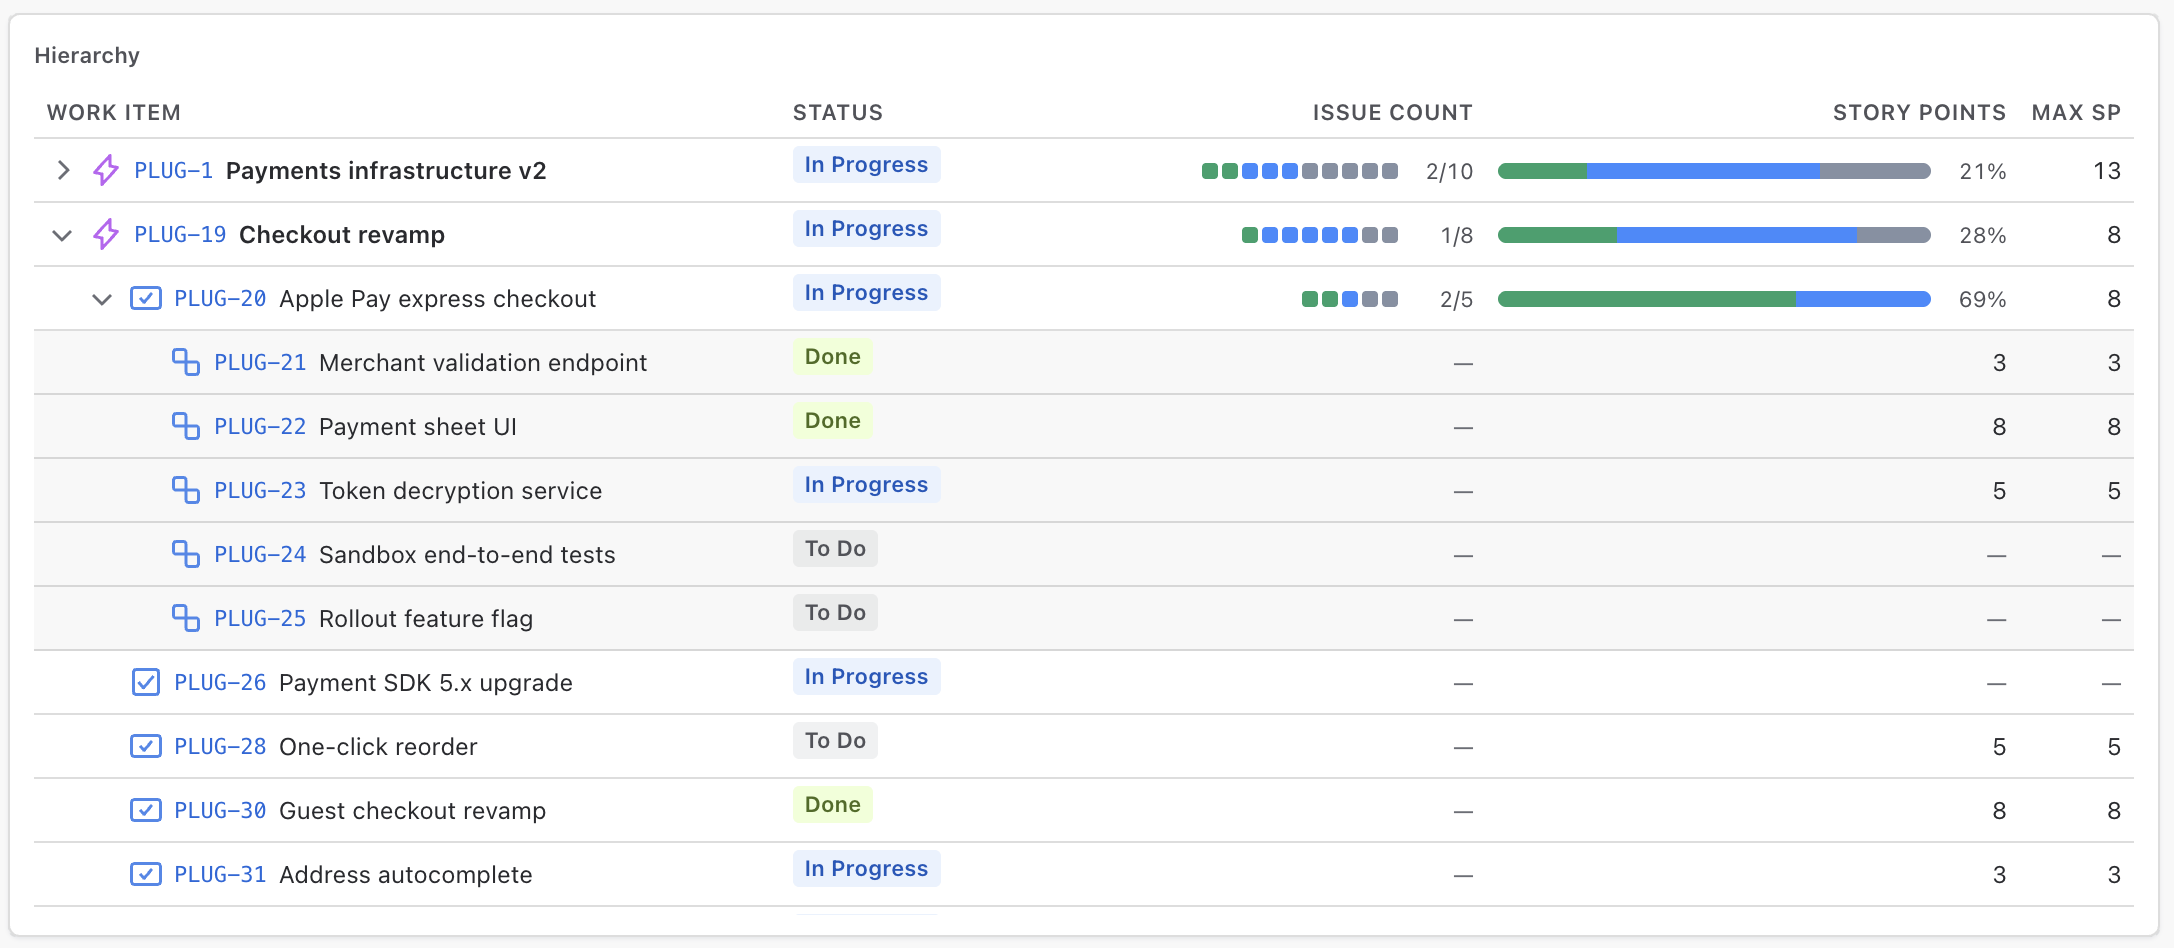
Show Jira issues as a tree: epic → story → sub-task, with progress rolled up
Jira shows the hierarchy one level at a time. A full tree with story points, counts and progress rolled up at every level — on a dashboard, or on the epic itself.
Read the guide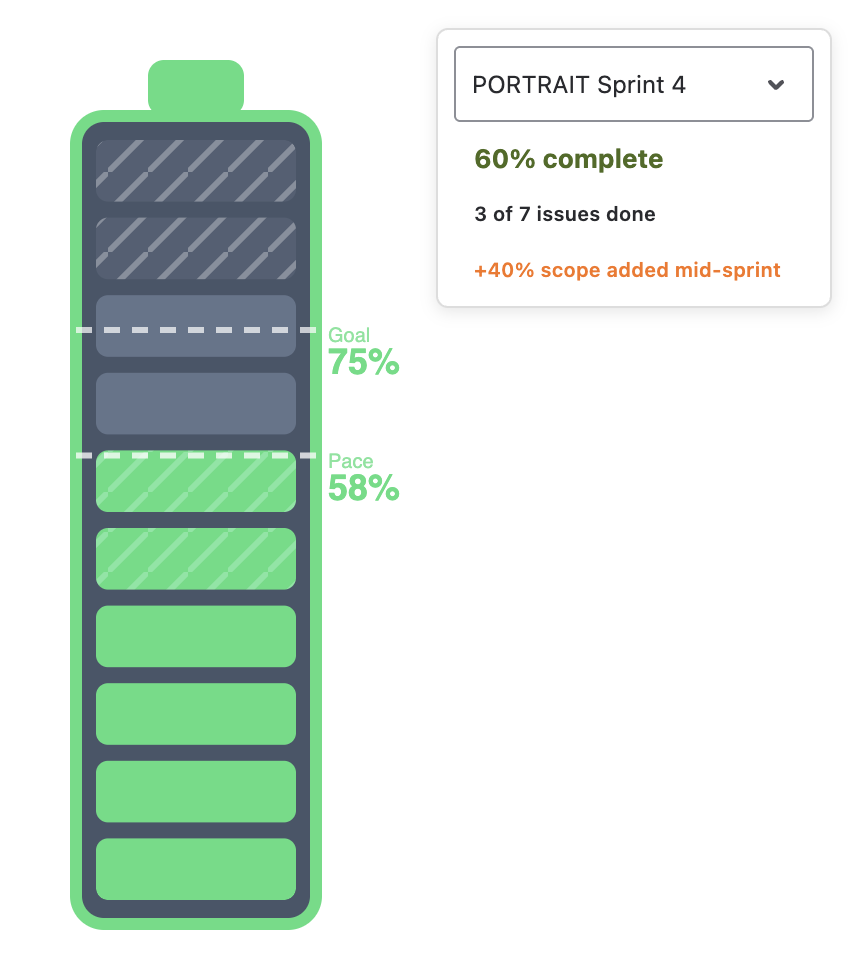
Say-do ratio on a Jira dashboard: planned vs. actual per sprint
The Velocity chart stays on the board. Delivered ÷ committed as a dashboard number — strict (commitment at sprint start) or live, with a previous-sprint badge, burnup and per-person bars.
Read the guide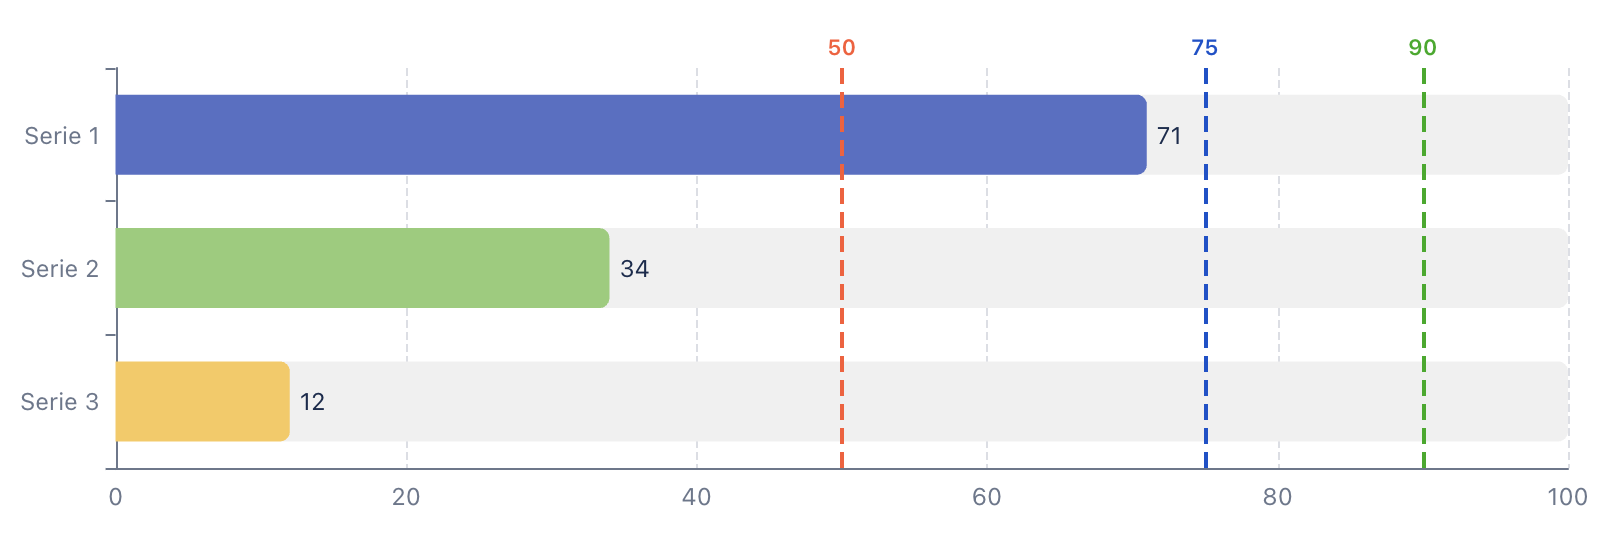
Show sprint progress on a Jira dashboard
A live progress bar, gauge or percentage for the active sprint — by story points or time, one board or several — with JQL-driven limits that follow the sprint.
Read the guide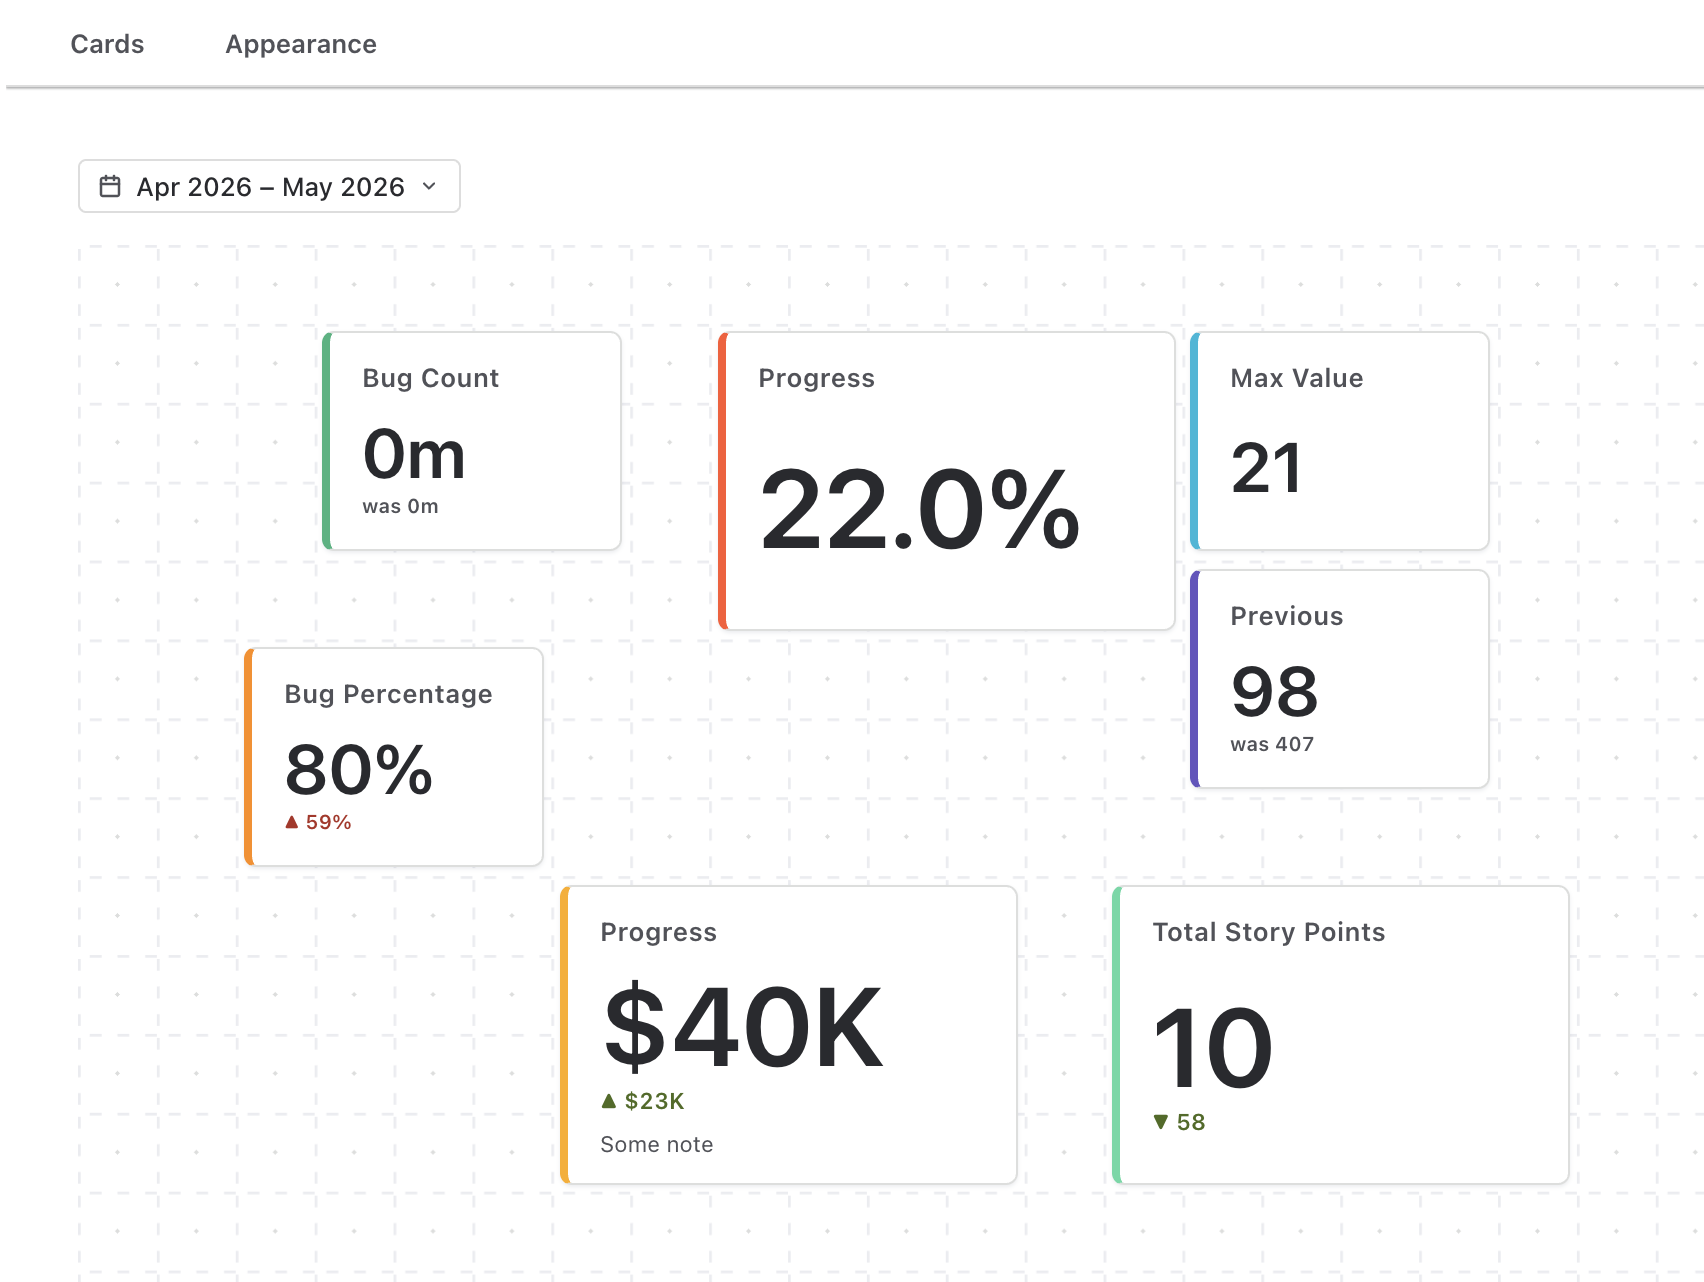
KPI counters and big numbers on a Jira dashboard
Open bugs, overdue, throughput, cycle time, backlog points — one large number per card with a previous-period badge, formula or target ring; and which of four gadgets fits which KPI.
Read the guide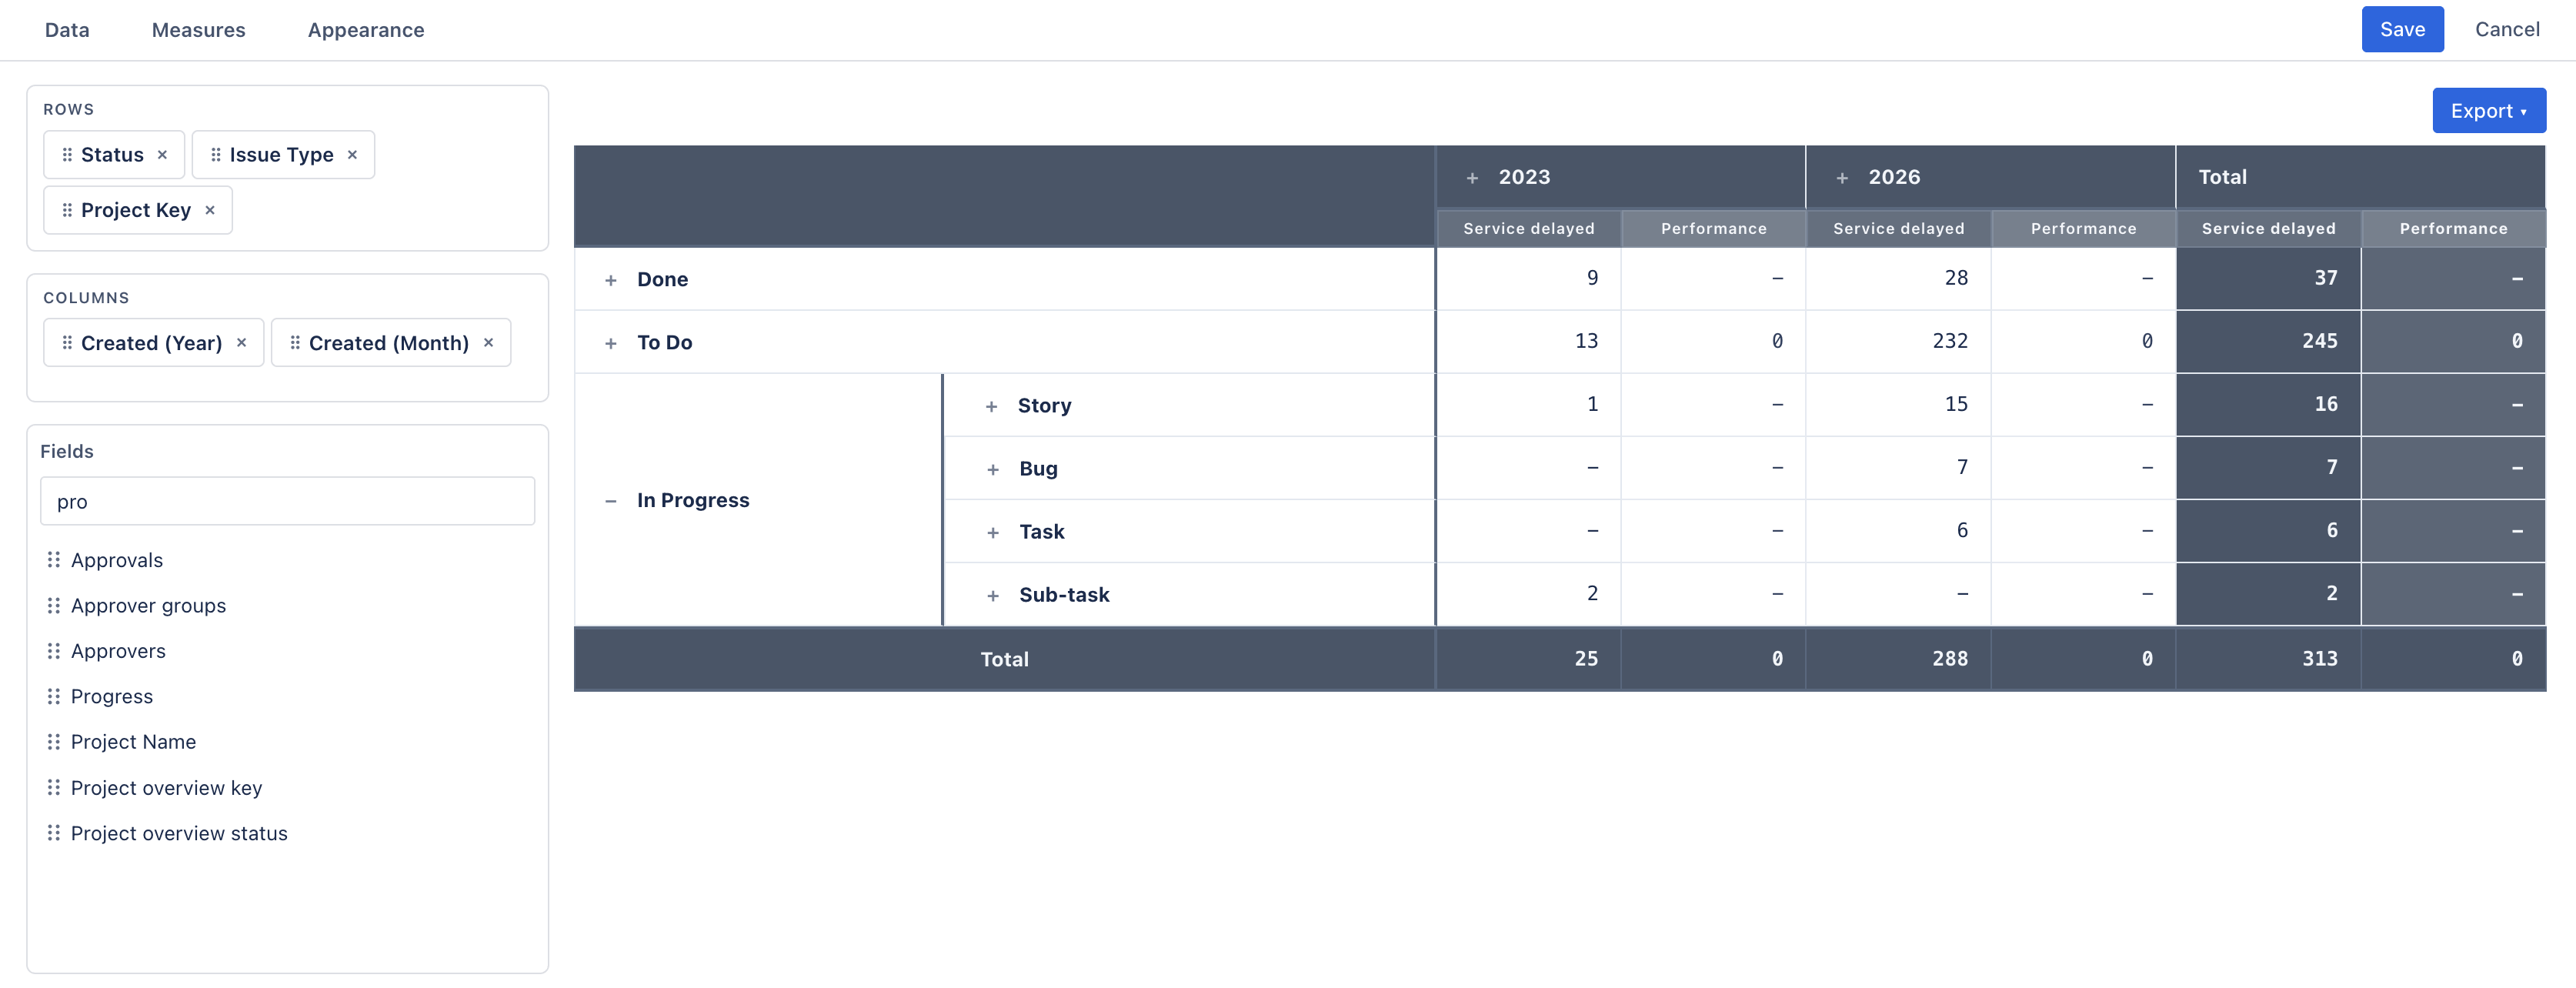
Sum story points by assignee and status on a Jira dashboard
Two Dimensional Filter Statistics only counts. A pivot gadget sums story points or time by assignee × status — nested, totalled, coloured, and drillable to the issues.
Read the guideLooking for the full reference instead? Every gadget has a documentation page, and the blog covers the longer comparisons. Missing a use case? Tell us at [email protected].