
Use cases · Jira dashboards
Sum story points by assignee and status on a Jira dashboard
"Story points per assignee, split by status" is one of the most common tables a team lead wants on a Jira dashboard — and the first place people reach is the Two Dimensional Filter Statistics gadget, which can only count. Here is what that gadget does, why it can't sum, and how to build the table with a pivot gadget instead.
Short answer. Jira's Two Dimensional Filter Statistics gadget crosses two fields and shows the number of issues in each cell; it has no option to sum story points, time or any other field, and it stops at two dimensions. A pivot table gadget does the same cross-tab over any JQL with Sum, Average, Min/Max, conditional counts and formulas as measures, any nesting depth on rows and columns, totals, cell colouring and click-through to the issues behind each cell.
What the native gadget does
Two Dimensional Filter Statistics takes a saved filter, an X-axis field and a Y-axis field, and renders a table of issue counts with totals. That is genuinely useful — status × assignee, priority × issue type — and it is the right gadget when counts are what you need.
It stops exactly where the question changes from "how many" to "how much":
- Counts only. No sum of story points, no time spent, no custom number field.
- Two dimensions, flat. No project › assignee nesting, no month buckets on a date field.
- Saved filters only — inline JQL isn't accepted — and the table is limited in how many rows it shows before truncating.
- No formulas, no colour. "Late share per team" or "points over estimate" can't be expressed, and nothing highlights the cell that matters.
The usual workarounds — exporting to Excel and pivoting there, or a Jira automation rule writing rollups into a custom field — work, but they are a copy of the data that is stale the moment it's made, and they live outside the dashboard.
Which Plugio gadget?
| If you want… | Use | Why |
|---|---|---|
| The cross-tab on a Jira dashboard, over one JQL | Multi-Dimensional Pivot Table (the setup below) | Nested rows and columns, sums/averages/conditional measures/formulas, colouring, drill-down, Excel export. |
| The same pivot on a full-page dashboard, sharing a filter bar with other widgets | Plugio Suite (Pivot Table widget) | One scope, period and filter bar for every widget, viewer-editable filters, previous-period baselines, one-click rows/columns swap. |
| A two-field matrix on the issue itself — priority × status over an epic's children | Plugio Panels (Matrix widget) | Lives in the issue view, computed over children, sub-tasks or linked work of that issue. |
Build the table with a pivot gadget
The gadget is Multi-Dimensional Pivot Table for Jira Dashboards. It runs one JQL search in the browser and computes the whole cross-tab from it, so totals are exact.
- Add the gadget (Add gadget → "Pivot Table"), open Configure.
- Data. Pick the project, and optionally a JQL filter — for the active sprint:
sprint in openSprints() AND issuetype not in subTaskIssueTypes()To use a saved filter, write
filter = "My filter". - Rows and columns. Drag Assignee into Rows and Status into Columns. Empty assignees group as Unassigned.
- Measures. Open Measures, add a measure with calculation Sum and field Story Points (or Story point estimate in team-managed projects). Keep or hide the default issue count with the eye icon.
- Totals and colour. Turn on the Total column and Total row; optionally give the sum a Dynamic heat colour so the heaviest cells stand out. Save.
Variations
Nest a second row level
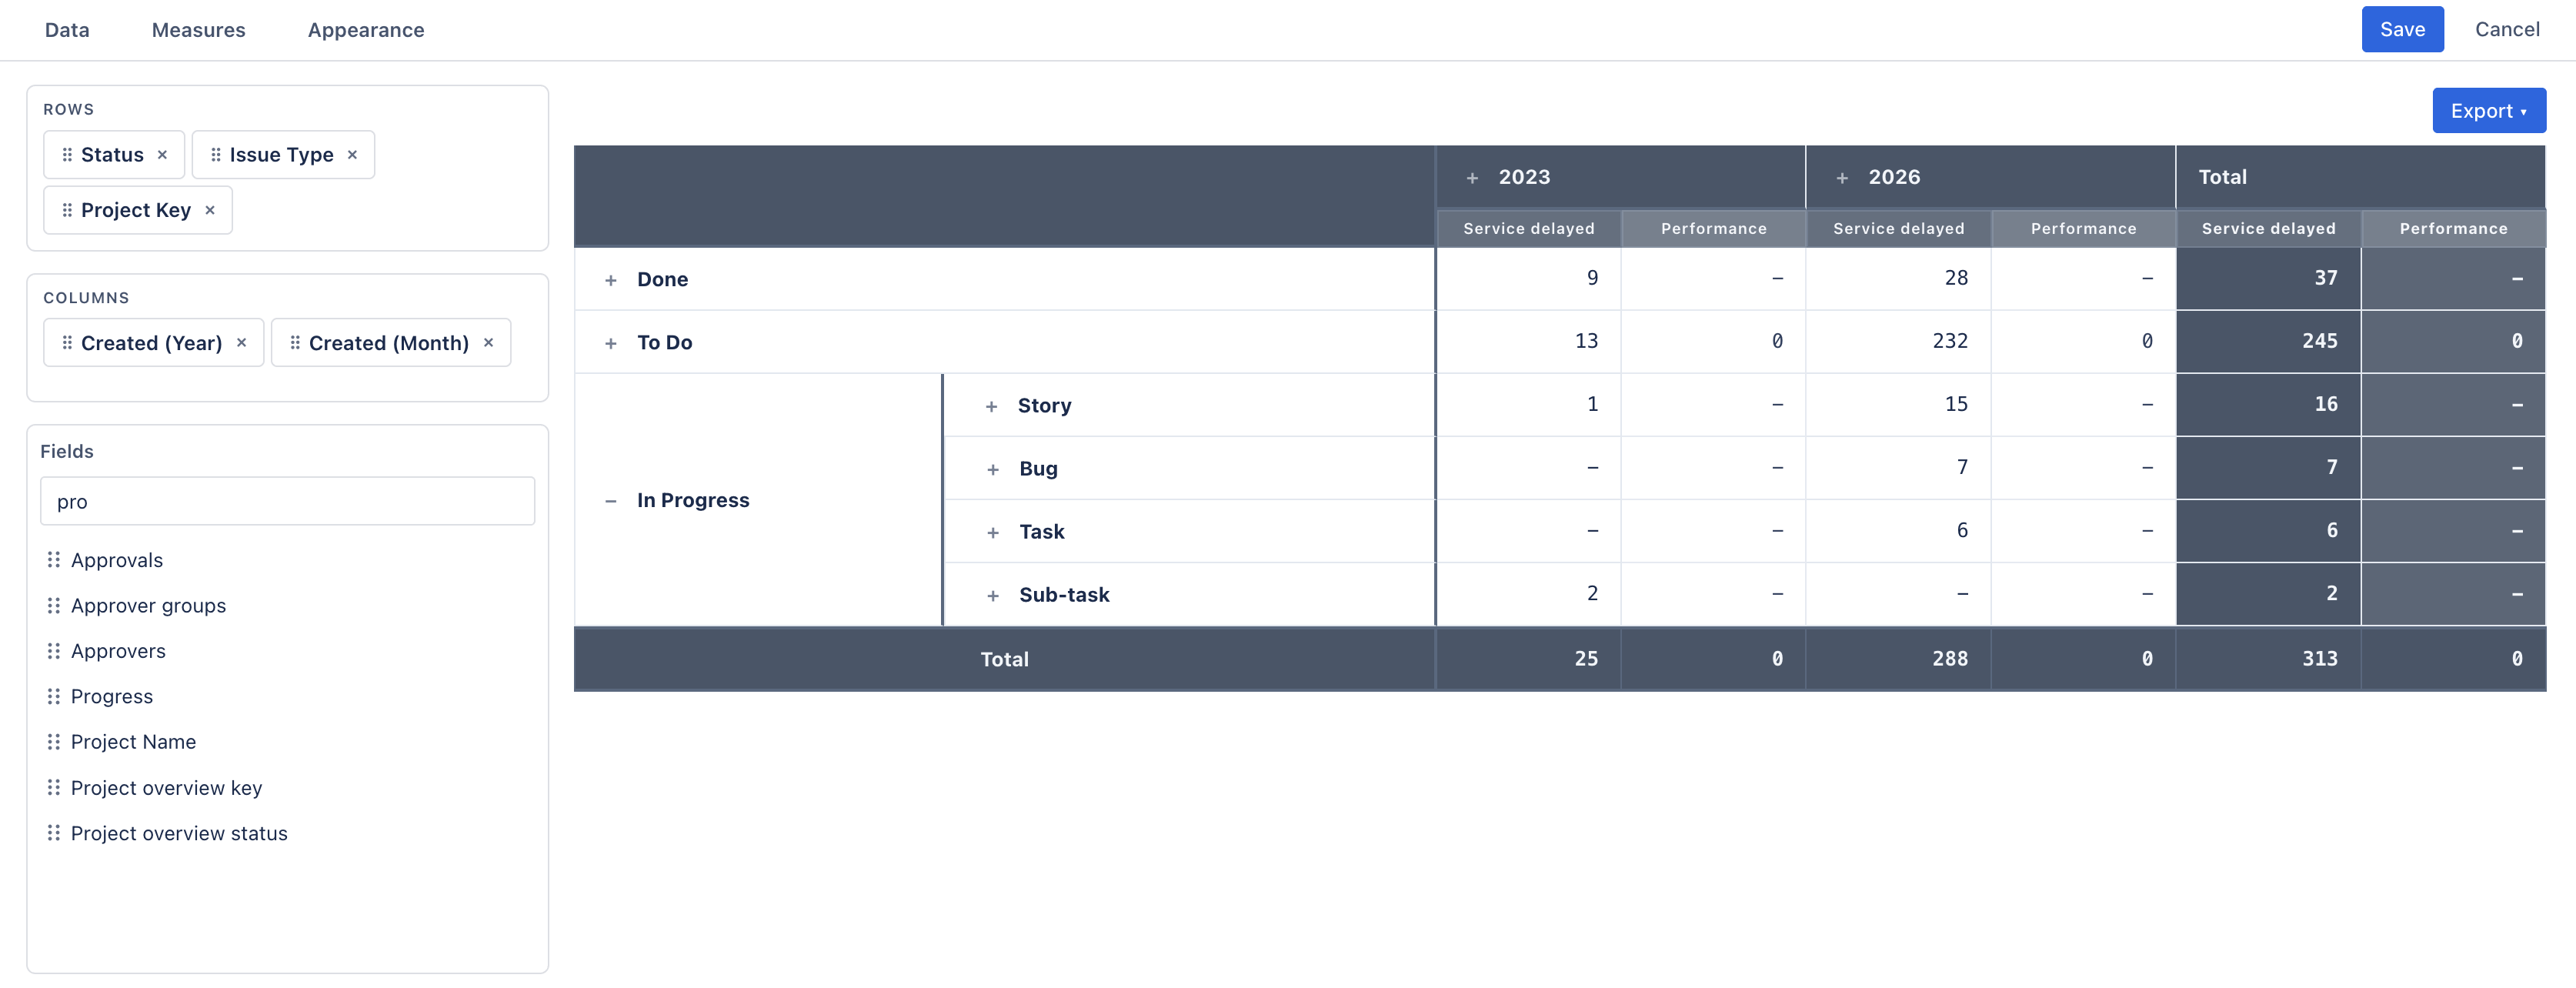
Add Issue Type under Assignee in Rows: each person expands into stories, bugs and tasks, and the collapsed row is the subtotal. Nesting works on columns too — Created (Year) › Created (Month) for a monthly matrix.
Time instead of points
Sum Time Spent or Original Estimate, or add both and a formula measure
{Time Spent} / {Original Estimate} * 100 for a burn ratio per cell. Formulas evaluate
in subtotal and total cells too, so the ratio is right at every level.
Conditional measures JQL can't express
A Conditional Count can compare one field to another: Resolved > Due date gives late deliveries per assignee per status; Time Spent > Original Estimate gives over-budget work per epic. JQL can't compare two fields of the same issue, so this is the part the gadget adds beyond a bigger filter.
Send it to a spreadsheet
Export ▾ on the gadget writes an .xlsx in the browser in three layouts:
normalized rows for Excel PivotTables and BI tools, a drill-down sheet with native outline groups, or
a print-ready report with merged headers.
Native gadget vs. pivot gadget
| Two Dimensional Filter Statistics | Pivot Table gadget | |
|---|---|---|
| Measures | Issue count | Count, Sum, Average, Min, Max, conditional count/sum, formulas |
| Dimensions | Exactly two, flat | Any number, nested on rows and columns; date fields bucketed by year/month/week/day |
| Data source | Saved filter | Project + JQL, or a saved filter; up to 10,000 issues |
| Drill-down | Cells link to the issue navigator | Every cell opens the exact JQL for that slice in the issue navigator |
| Colour / export | — | Heat map or range colouring per measure; three Excel layouts |
| Cost | Included | Free on the Marketplace |
Try it on your own data. Multi-Dimensional Pivot Table is free on the Atlassian Marketplace. The documentation covers measures, formulas, colouring and export in detail.
Frequently asked questions
Can the Two Dimensional Filter Statistics gadget sum story points?
No. It counts issues per cell and has no measure setting. Summing story points, time or any numeric field on a dashboard cross-tab needs a pivot table gadget or an export.
Is the total an exact sum or an estimate?
Exact. The gadget loads the issues behind the query (up to 10,000) and computes every cell, subtotal and total in the browser — an Average total is a true average, not an average of averages.
What about team-managed projects, where the field is "Story point estimate"?
Pick that field as the measure's field. If a dashboard mixes both project types, add two Sum measures — one per field — and a formula measure {Story Points} + {Story point estimate} for the combined figure.
Can I see which issues are behind a cell?
Yes — every value cell is a link that opens the Jira issue navigator with the JQL for exactly that cell: the data-source query plus one clause per row and column level.
Who can see the data?
The gadget reads Jira as the viewer, through the REST API. Everyone sees only the issues their permissions allow; nothing is written to Jira, nothing leaves your site, and exports are generated in the browser.