
Use cases · Jira dashboards
Show Jira issues as a tree: epic → story → sub-task, with progress rolled up
"Is there a tree view of issues in Jira?" comes up whenever a team wants the whole epic → story → sub-task structure on one screen: every branch expandable, and the numbers at each level summed from the level below. Jira Cloud shows the hierarchy one level at a time and rolls up by issue count only. Here is what the native screens give you, and how to get a full tree with story points, counts and progress at every level — on a dashboard, or on the epic itself.
Short answer. Jira has no single tree view of issues: the issue view shows one level of children, the backlog's epic panel shows totals per epic, and Plans (Premium) shows a hierarchy without sub-tasks. For a dashboard tree, the Hierarchy widget in Plugio Suite lists every epic in scope as a row, expandable down to sub-tasks, with columns you compose — status, assignee, dates next to a progress bar, issue count or story point sum rolled up over each branch. For the same tree on the epic page, the Progress widget in Plugio Panels draws it under a percentage with a roll-up footer.
What Jira shows natively
- The issue view lists an epic's child work items and a story's sub-tasks — one level each. The progress bar on the epic counts items done; it doesn't sum story points, and a sub-task's estimate never reaches the epic.
- The backlog's epic panel (company-managed projects) shows story point totals per epic, split by status. It is a side panel of the backlog, not a tree, and stops at the story level.
- Plans (Jira Premium) shows initiatives, epics and stories as an expandable hierarchy with estimate roll-ups. Sub-tasks are excluded from both the tree and the numbers, and it is a planning screen, not something you place on a dashboard.
- The issue navigator is flat.
parent = PLUG-19lists a story's children, but there is no nesting, and no totals other than the row count. - Dashboards have no hierarchy gadget at all. Filter Results shows a flat list; Issue Statistics counts by a field. Neither knows that a row has children.
Where these stop: nothing shows more than one level at a time, nothing sums story points or time through the tree (sub-tasks least of all), and nothing puts the structure on a dashboard next to the other numbers a team looks at.
Which Plugio app?
Three Plugio apps have something called "hierarchy", and they answer different questions. Pick by where you want the tree to live:
| If you want… | Use | Why |
|---|---|---|
| The tree of many epics on a dashboard — every epic in a project, sprint or JQL scope, expandable to sub-tasks, with rolled-up columns | Plugio Suite (Hierarchy widget) (the setup below) | Rows are epics; columns mix the row's own fields with roll-up values (bar, dots, fraction or number); one filter bar for the whole dashboard; placeable on native Jira dashboards. |
| The tree of one epic, on the epic itself — the evidence behind its percentage | Plugio Panels (Progress widget) | A percentage by count, story points or time; on the wide panel, the work-breakdown tree with indent, collapse and a roll-up footer. |
| A nested breakdown by fields — issue type → status → priority — as tiles or rings | Treemap & Issue Hierarchy Charts | "Hierarchy" there means nested grouping by any fields, sized by count or story points. Not the parent-child tree. |
Build the tree on a dashboard (Plugio Suite)
The Hierarchy widget takes every epic in the dashboard's scope and draws its full tree. An epic that appears always brings its whole subtree — a branch is never cut in half by a filter.
- Create the dashboard. Open Plugio Suite from the Apps menu, click New dashboard and set the scope: one or more projects, a JQL query, or a board's sprint.
- Add the widget. Click + Widget and pick Hierarchy. The default setup already shows Status, Assignee and a progress bar per branch.
- Compose the columns. On the Data tab, mix two kinds of column. Field
columns show the row's own attribute — Status, Assignee, Due date. Value columns
are a metric rolled up over each branch:
Issue count → Dots one square per item, coloured by status Story Points → Bar status split + % done Story Points → Fraction 21 / 43 Original estimate → Number plain totalLeaf rows show their own value; parents show the subtree total.
- Decide how sub-tasks count. With sub-tasks shown, Roll up from picks the reading: Lowest level counts each branch at its deepest items (sub-tasks are the real work), Stories & tasks keeps sub-tasks visible but out of every number (they are a checklist). A story with sub-tasks always shows its own checklist bar either way.
- Choose which epics. Unresolved epics only (the default) or all statuses, in rank order; optionally include epics with no items yet.
- Set the reading mode. On the Format tab: expand collapsed, epics open, or the whole tree by default; turn on the search box for a quick find over keys and summaries. Search is a view filter only — a parent that stays keeps its full numbers.
- Share it. Save, share with everyone on the site, and — if the team lives on a native Jira dashboard — add the Plugio Suite Dashboard gadget there and pick this dashboard.
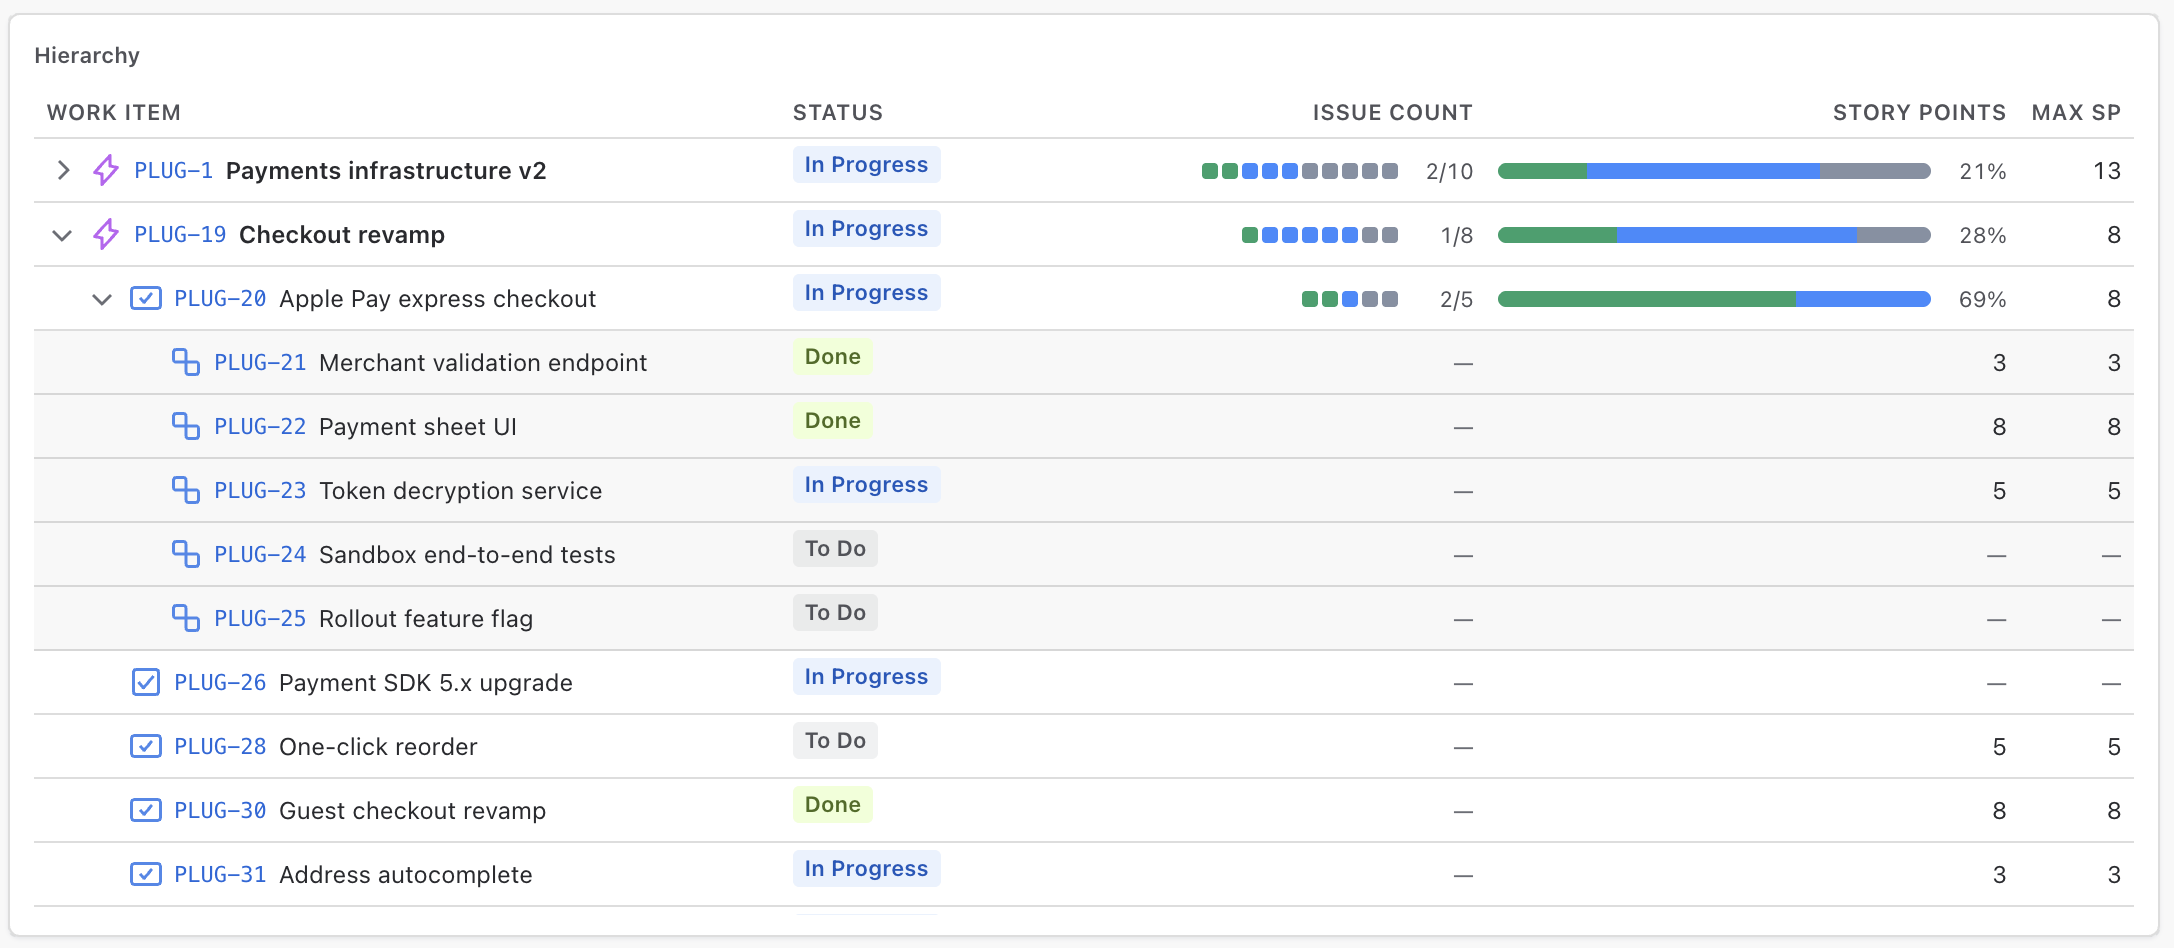
Reading the tree: the caret expands a branch, the issue key opens the issue in a new tab, and hovering a bar, dots or fraction shows the exact split with a total. If a very large scope forces a cut, whole branches are dropped and reported ("Showing 40 of 112 epics") — a rendered bar is never a partial count.
Team-managed projects
Team-managed projects estimate in Story point estimate, not Story points. Pick that field in the value column; for a mixed dashboard, add one value column per field.
Build the tree on the epic (Plugio Panels)
When the question is asked from inside an epic — "how far is this one, and what's left" — the tree belongs on the issue view rather than a dashboard. The Progress widget in Plugio Panels shows the percentage in the sidebar and, on the wide panel below the description, the tree it is computed from.
- Open Plugio Panels from the Apps menu and create a panel for the project (or start from the Epic Overview template).
- Add a Progress widget and set its Source to Full hierarchy — the epic's children and their sub-tasks. Direct children stops at stories; Subtasks is the right source when the panel targets stories.
- Pick the basis: issues (head count), story points, or time — remaining against original estimate.
- Choose the tree columns for the wide panel: status, priority, assignee, story points, age. Numeric columns sum in the roll-up footer.
- Add rules if you want the percentage banded — up to 40 red, up to 70 yellow, and so on — and save. Every epic in the project now carries the panel.
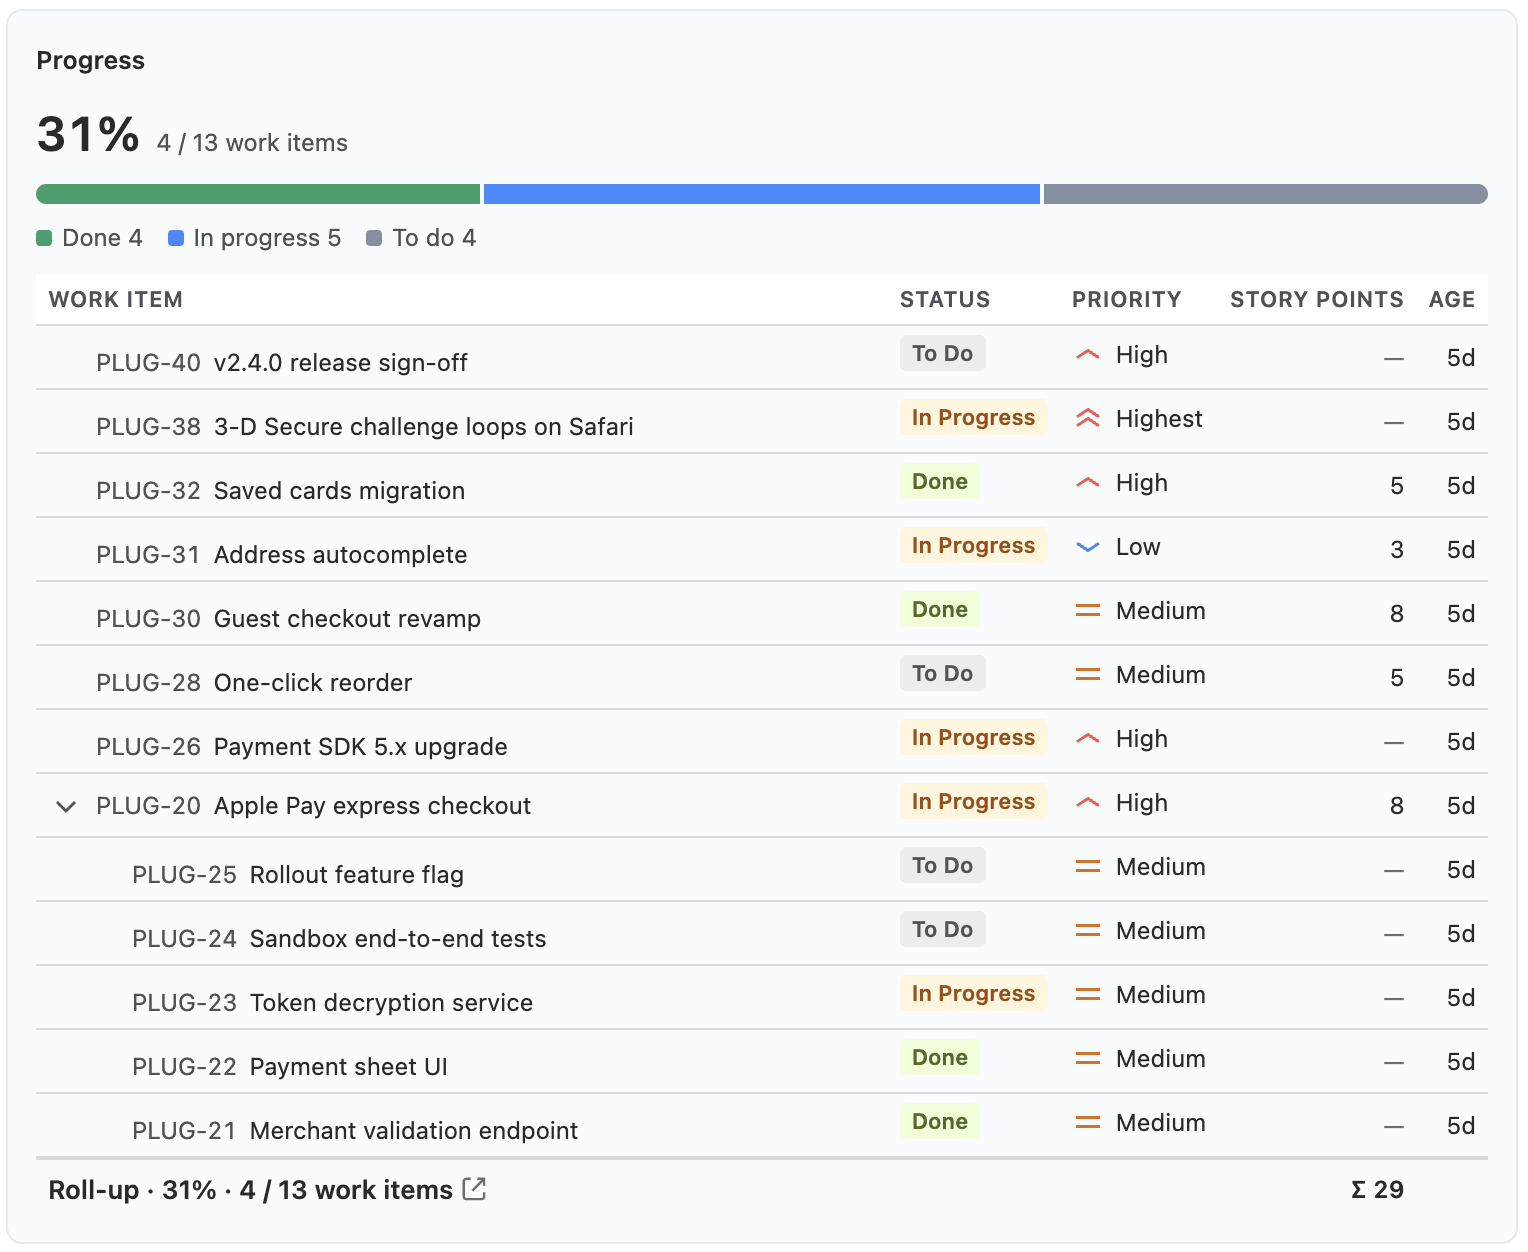
Both apps handle the mixed-estimate case — a story and its sub-tasks carrying points — with a per-field setting that decides which level counts, so nothing is silently doubled. The background on why that matters is in the story point rollup post.
Variations
One epic at a time, on a dashboard
Add a Parent filter to the Suite dashboard and make it Editable. The filter bar becomes an epic switcher: viewers pick an epic from the ones actually present in the data and every widget — the tree, a gauge, a pivot — follows.
The sprint's tree
A sprint-scoped dashboard derives the tree from the sprint's issues: the epics touched by the sprint, with only the sprint's stories and sub-tasks under them. Viewers can flip to past sprints.
Time instead of points
Value columns accept any numeric field, including time tracking. Sum of Original estimate as a number next to Sum of Time spent gives an estimate-vs-actual per branch; a derived duration such as cycle time works as an average per branch.
A breakdown instead of a tree
If the question is really "how is this epic's work distributed" — by assignee, by status — the Breakdown widget in Suite and the Breakdown widget in Panels show each epic or story as a stacked bar of its children. Same data, a different shape.
Native vs. Suite vs. Panels
| Jira issue view / Plans | Plugio Suite (Hierarchy) | Plugio Panels (Progress) | |
|---|---|---|---|
| Levels shown | One level per screen; Plans: no sub-tasks | Epic → story → sub-task, expandable | Epic → story → sub-task, expandable |
| Where | The issue, the backlog, the Plans screen | A full-page dashboard or a native dashboard gadget | The epic's own page (sidebar + wide panel) |
| Roll-up | Issue count; Plans: estimates without sub-tasks | Count, story points, time, any numeric field — at every level | Count, story points or time; numeric columns summed in the footer |
| Scope | One issue | Every epic in a project, JQL or sprint scope | The current work item's hierarchy |
| Cost | Included (Plans: Premium) | Free on the Marketplace | Free on the Marketplace |
Build the tree on your own data. Plugio Suite is free on the Atlassian Marketplace; the Hierarchy widget documentation covers every column type and roll-up setting. There is also a live demo with sample data.
Want the tree on the epic itself? Plugio Panels — also free, with its own demo.
Frequently asked questions
Does Jira have a tree view of issues?
Not as one screen. The issue view shows one level of children, the backlog shows epic totals, and Plans (Premium) shows a hierarchy without sub-tasks. A full epic → story → sub-task tree with roll-ups needs a Marketplace app.
Can the tree be placed on a normal Jira dashboard?
Yes. Build the dashboard in Plugio Suite, then add the Plugio Suite Dashboard gadget to a native Jira dashboard and pick it. The tree renders inside the gadget with the same expand and hover behaviour.
Do sub-task story points count in the epic's total?
Your choice. "Roll up from: Lowest level" counts each branch at its deepest items; "Stories & tasks" keeps sub-tasks visible but out of the numbers. When a story and its sub-tasks both carry points, a per-field overlap setting decides which level counts.
How many epics can the tree show?
Up to 100 epics per widget, in rank order, each with its full subtree. If a scope is larger, whole epics are dropped and the widget says so ("Showing N of M epics") rather than rendering a partial branch.
Who can see the numbers?
Both apps read issues through the Jira REST API as the person viewing. Everyone sees only the issues their own Jira permissions allow, and nothing leaves your Jira site.
What about the Treemap app's "issue hierarchy"?
That app nests any fields — issue type → status → priority — into tiles or rings sized by count or story points. It is a grouped breakdown, not the parent-child tree. For epic → story → sub-task use the Hierarchy widget in Suite or the Progress tree in Panels.