
The Jira issue view shows the ticket, not the work around it: 12 gaps Plugio Panels fills
Open an epic in Jira and you get its fields, its description, a progress bar that counts child items, and a flat list of linked issues. Open a story and you get much the same. What you don't get is the work around the ticket: how many story points are actually done under it, which of its blockers are still open, how long it has been sitting in its current status, whether the release it ships in is on track. Those answers exist in Jira — you just have to leave the issue to find them.
Plugio Panels puts them on the issue. A project admin builds a panel once — a set of widgets with sources, formats and colour rules — targets it at an issue type, and from then on every matching issue shows it to everyone, with no action on their part. Below are the twelve gaps in the issue view we hear about most, and what Panels does about each. Some are widgets; the more interesting ones are design decisions.
01Two surfaces, two forms of every widget
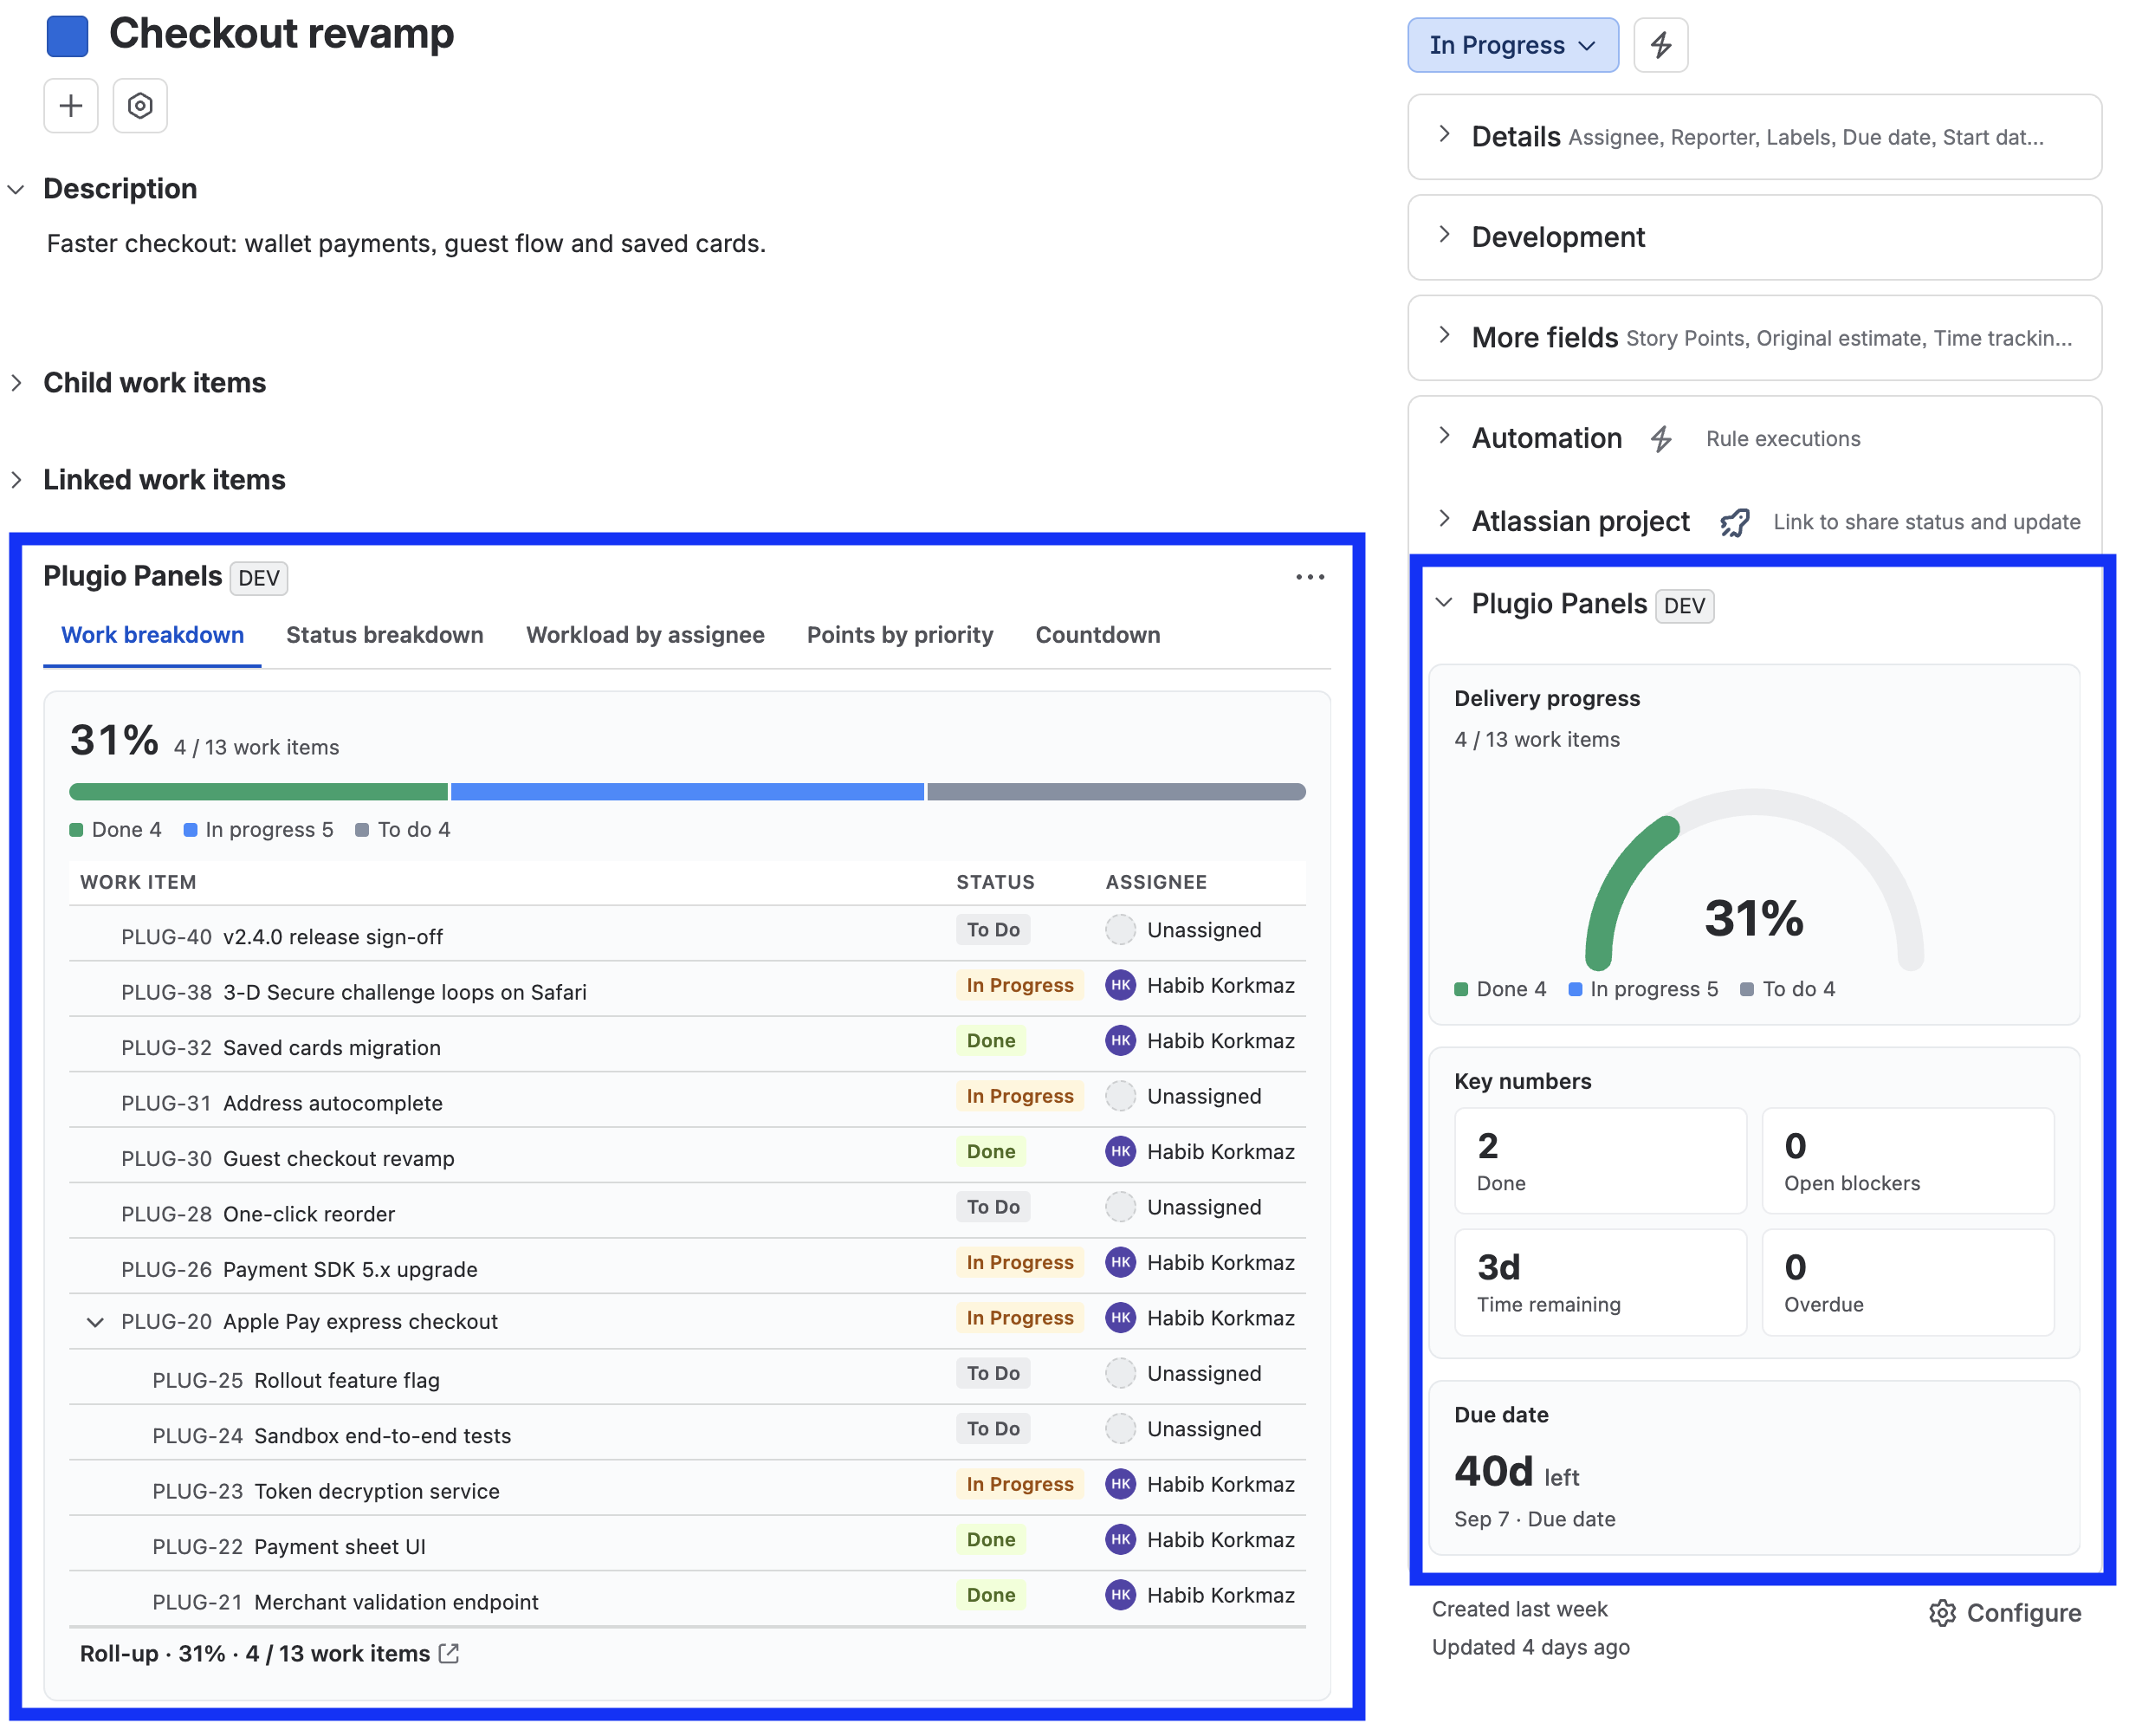
Native: the sidebar is fields; the main column is description and activity. Apps get one glance-panel slot or one content panel, and most pick one.
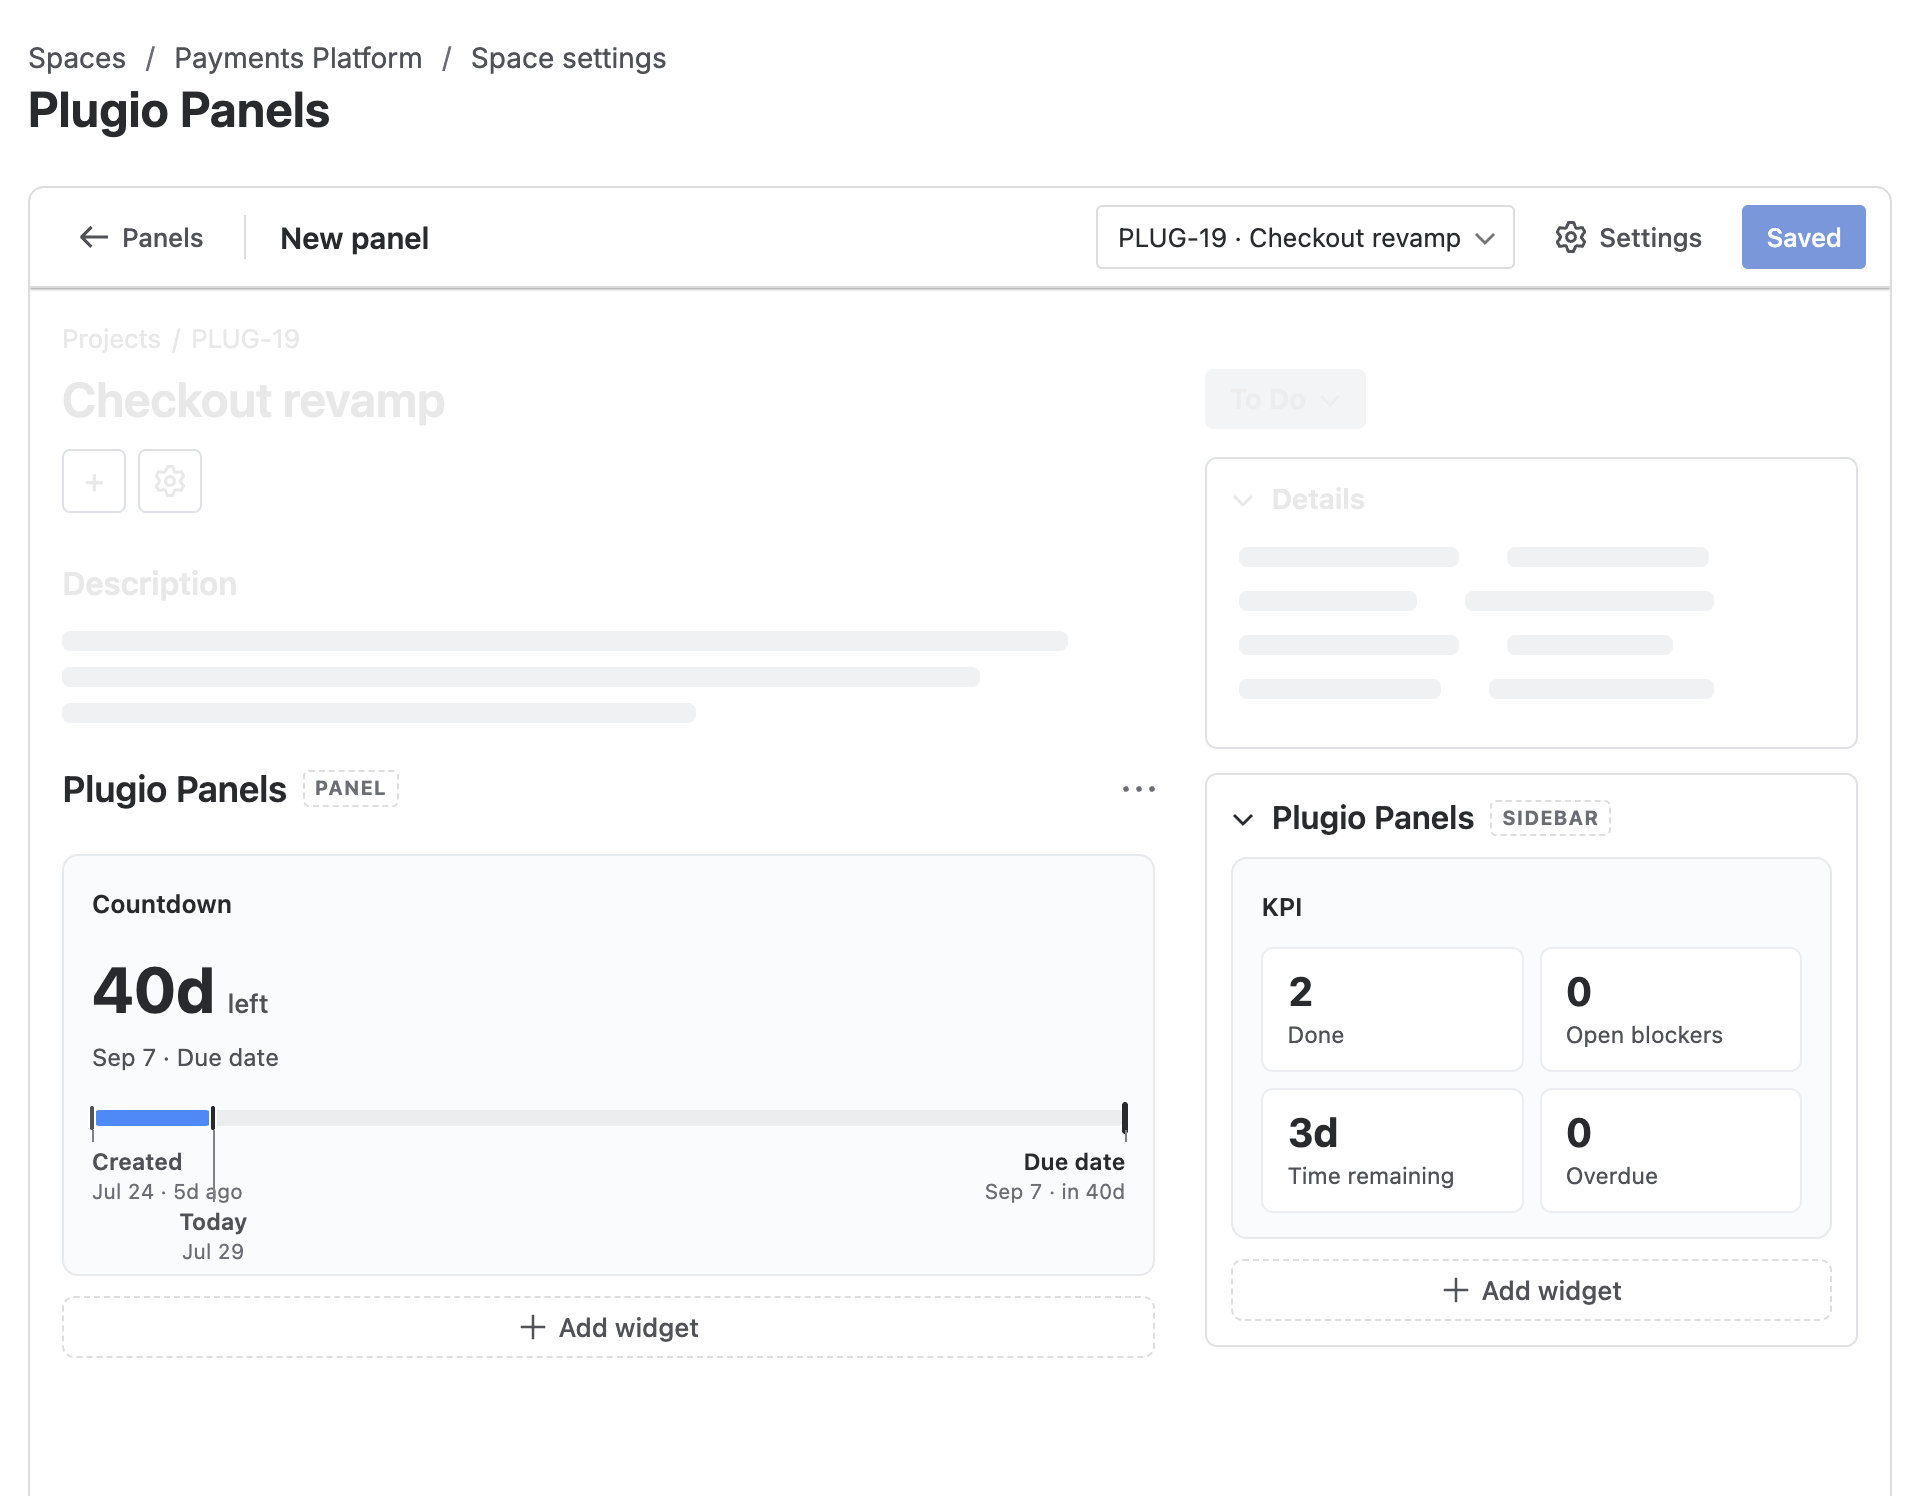
Panels renders on both: the sidebar in the right column (313–560 px, always visible, no user-side off switch) and the wide panel in the main column (full width, tabs or stacked). Every widget type has a compact form designed for the sidebar and a large form designed for the panel — not the same component squeezed. Progress in the sidebar is a bar, gauge or donut with a percentage; on the wide panel it's the hierarchy tree that is the ratio's evidence, with a rollup footer. The editor is a ghost of the real issue page with both zones at their real positions, and you can drag the column divider to preview the sidebar at any width Jira actually gives it.
02A different panel for a Payments bug than for any bug
Native: issue layouts are per issue type per project. There is no "this layout, but only when component = Payments".
A panel targets an issue type and, optionally, a JQL condition
— component = Payments, labels = escalated, priority in (Highest,
High). An issue shows exactly one panel: the first in the list whose condition it matches,
evaluated top-down. So the list order is a priority order — the narrow "Payments Bug" panel sits above
the general "Bug Triage" panel and wins when it applies. Hide a panel for a season without deleting
it; duplicate one to fork a variant.
03Story point rollup when the story and its sub-tasks carry points
Native: sub-task estimates don't roll up. Any tool that sums the full hierarchy risks counting a story's points and its sub-tasks' points both.
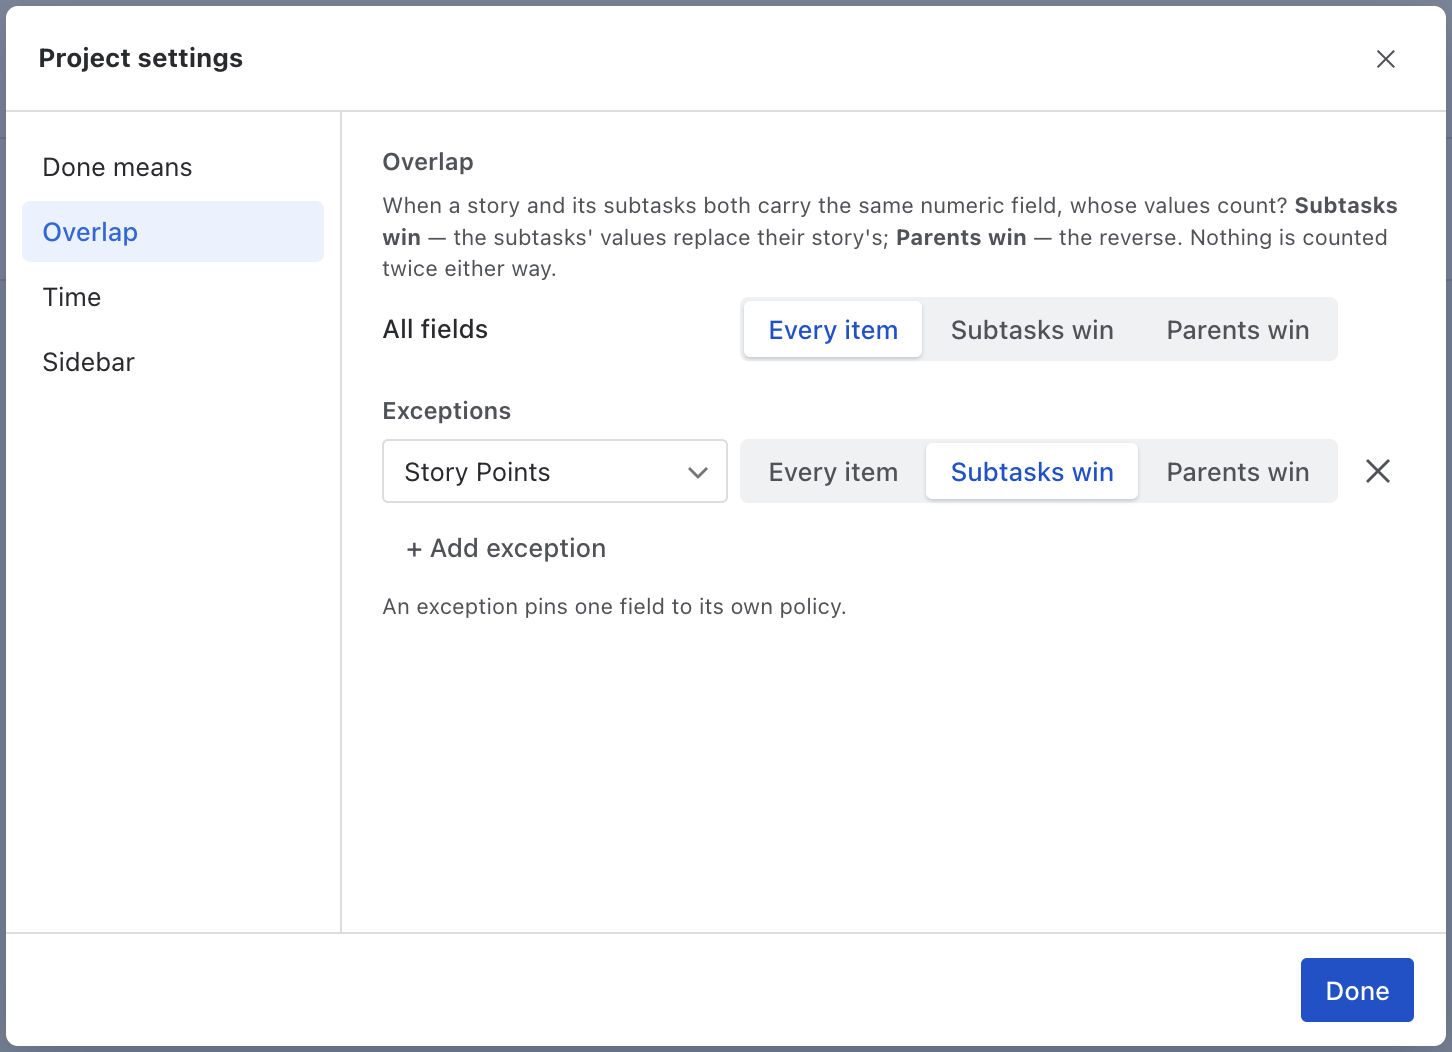
This is the one that quietly breaks most rollup tools. Panels has a project-level Overlap policy for the full-hierarchy source: Every item, Sub-tasks win (a story with valued sub-tasks drops its own value) or Parents win. One default covers every numeric field; exceptions pin single fields to their own policy — story points one way, time estimates another. The choice applies wherever the field is summed — progress ratios, Σ footers, KPI values, chart totals — so the same field totals the same in every widget and nothing is doubled.
04"Done" is what your team says it is
Native: progress means status category = Done. If Ready for QA lives in the Done category, it counts as done everywhere.
Done means is a project setting: Jira's Done category by default, or a checklist of specific statuses from the project's real workflow. Every widget reads it — progress ratios, done/total counts, release completion, the Breakdown's %done, overdue rules. Change it once and every panel in the project agrees on what finished means. At least one status always stays ticked, so "nothing counts as done" can't happen by accident.
05KPI tiles on the issue, each with its own source
Native: no numbers about related work on the issue at all. Not "open blockers", not "points remaining", not "days to nearest child deadline".
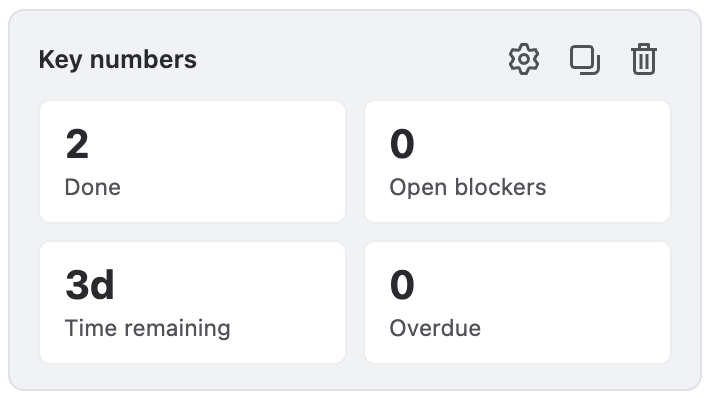
The KPI widget is a grid of tiles, and the source is per value, not per
widget: one tile counts Linked work items where status != Done (open blockers), the next sums
Story Points over the full hierarchy where statusCategory = Done, the third runs a JQL with
{{currentIssue.key}} substituted. Derived values — cycle time, age, time until a date —
aggregate like any number: Min of Time until Due across children is the nearest child
deadline. Formula rows do arithmetic across tiles with round, coalesce and
friends, and hidden values compute without showing.
06Linked issues grouped by link type, with totals
Native: the Linked issues section is a flat list with fixed columns. No story points, no due dates, no sums.
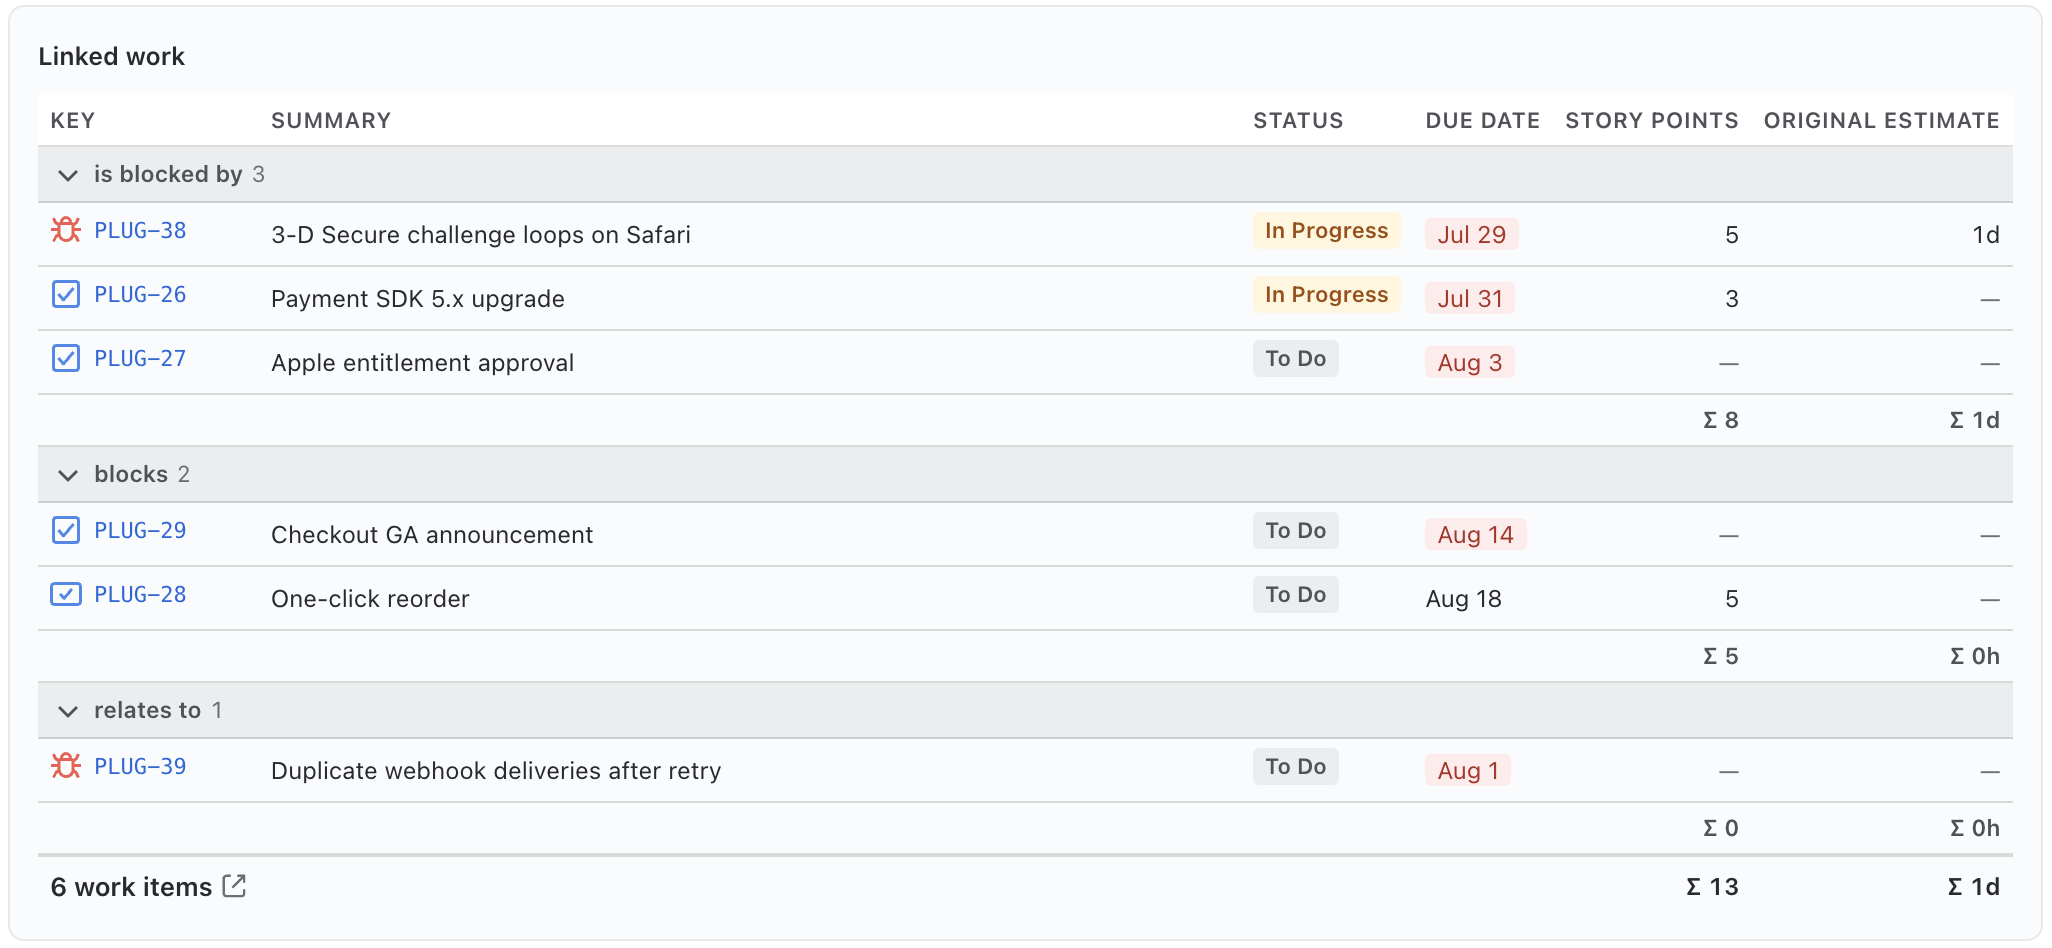
The List widget is a real table over any source — linked issues by default — with a free column set from your site's field catalogue (custom fields included, plus derived Age, Due in and Cycle time), sorting, and a numeric footer. Group by link type and you get one section per link phrase the issue actually uses — is blocked by, blocks, relates to — each with its count and its own Σ line. That's the blocked-by / blocks board that used to take three apps side by side. Marquee fields render as Jira does — status badge, assignee avatar, priority icon — so it reads like Jira, not like a spreadsheet.
07Time in status, on the issue itself
Native: status history is buried in the History tab, one transition per line, no durations.
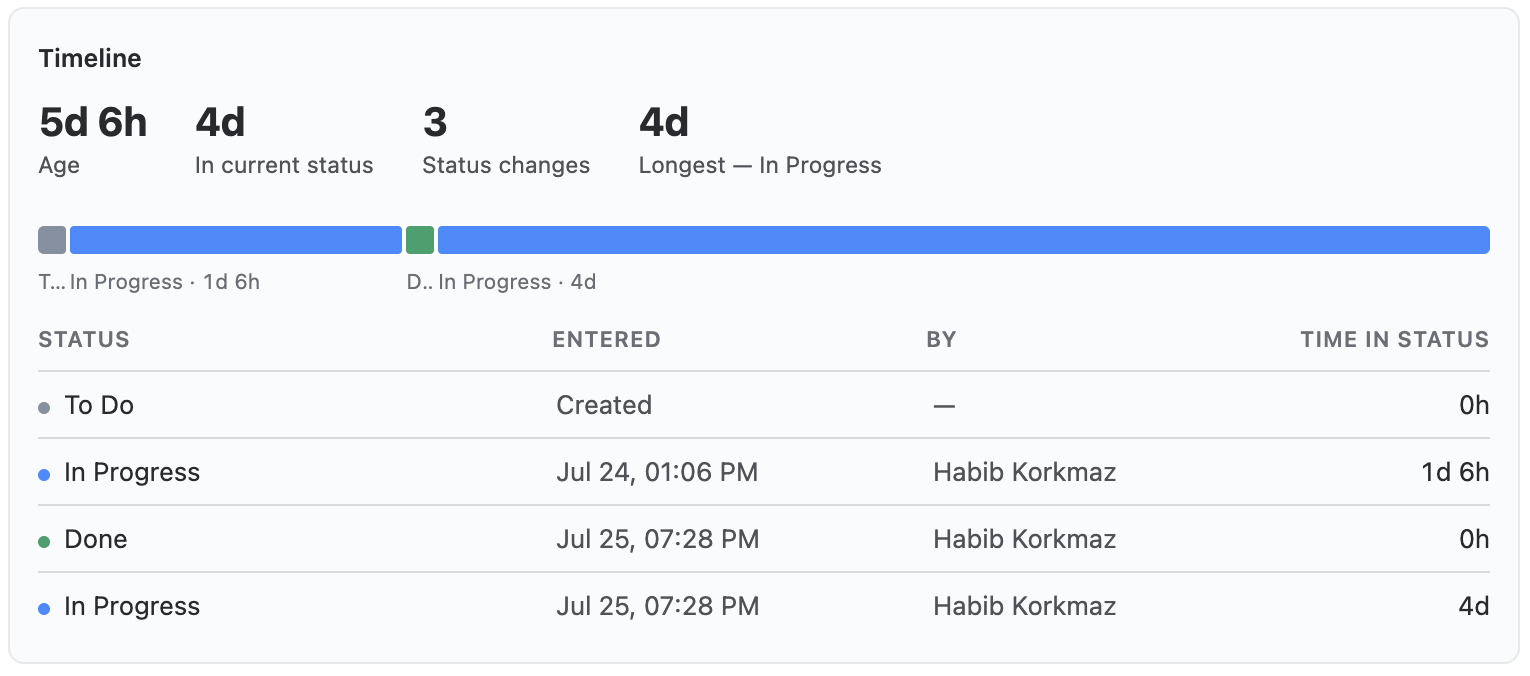
The Timeline widget makes the number that makes someone act — time in the current status — the headline, with a proportional band of the issue's whole status history underneath. On the wide panel it adds the transition table: what moved, when, who moved it, how long it sat. Re-entered statuses can be shown as separate visits or one total. Colour rules band the days in the current status — green to 2d, yellow to 5d, red beyond — and a resolved issue is never coloured, because "6 days in Done" isn't a problem.
08Due date countdown: the deadline as a strip, not a date
Native: the due date is a date. Whether that's tomorrow or in a quarter is arithmetic for the reader.
Countdown counts days to (or since) any date field on the issue — a due date, a sprint end, a custom target. In the sidebar it's the number and its date line; on the wide panel it becomes a date strip: the target placed between the start anchor and today, so how much of the window is already spent is visible at a glance, with other date fields marked on the same axis — a start date beside the deadline, a sprint end beside a release. Counting up, the strip is the issue's lifetime. A missed date on an unresolved issue reads red without any rule; the day count is computed at paint time, so a cached page never shows a stale number.
09Release tracking: the fix version this issue ships in
Native: Fix version is a link. Whether the release is on track lives on the Releases page.
The Release widget reads the issue's first unreleased fix version and shows the release-date countdown plus completion of everything in that version. On the wide panel it adds the whole version as a table — the current issue marked — with your columns and a footer that always reports the real total. The Parent widget does the same trick upward: the ancestor chain (parent → epic → initiative, up to three levels) with each level's own children's progress beside it, because a breadcrumb without progress is just what Jira already has.
10A risk matrix (probability × impact) on the issue
Native: nothing two-dimensional anywhere in the issue view.
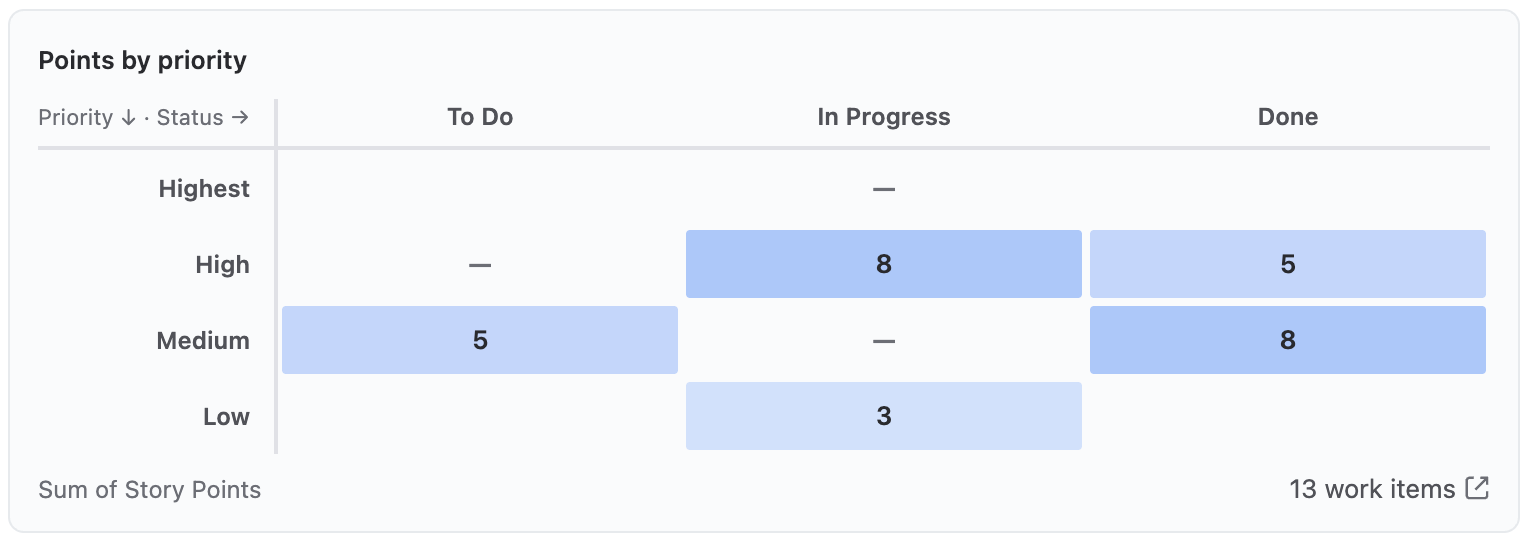
The Matrix takes two fields as axes over any source — probability × impact across an epic's children, priority × status, component × assignee — with a count or a Sum/Average of a numeric field in each cell. Cell tint encodes one thing only, density; clicking a cell lists the issues behind it with an "open in Jira" action. It's wide-panel only by design: a matrix can't say anything at 300 px, so the picker shows it disabled for the sidebar rather than rendering an unreadable one. The Breakdown is the scannable cousin — one stacked bar per assignee (or per direct parent: stories as rows, each stacked from its own children), split by status, expanding into the issues behind each row.
11Conditional formatting that knows what "overdue" means
Native: no conditional formatting on the issue view at all.
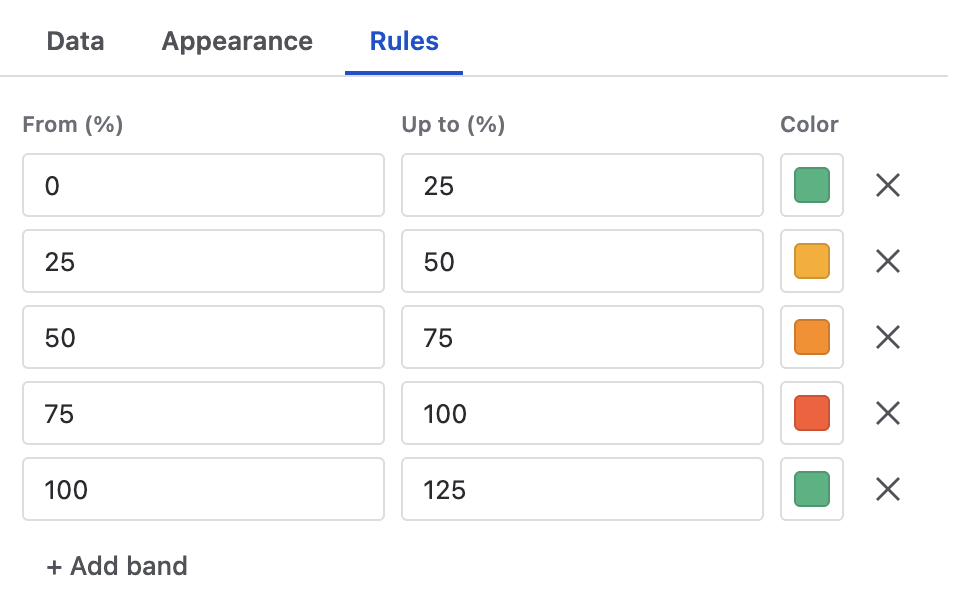
Almost every widget has a Rules tab: ordered colour bands in whatever unit the widget measures — % done for Progress, days left for Countdown, days in status for Timeline, the raw value for a table column or a KPI tile. Tables and tile grids keep bands per column. Where a value can be overdue — a past due date on an unresolved issue — red is built in and needs no band. Where it can't be, there is deliberately no red floor: an age isn't a missed promise, and sitting in a status isn't wrong in itself. The Fields widget applies the same idea to the issue's own fields — the three that matter, large, and painted by rule.
12Build the panel once, copy it to the next project
Native: issue layouts and screen schemes are shareable, but nothing about an app's per-project configuration is.
Panel definitions are stored as a project property — on your Jira site, not on our servers, and Jira itself enforces that only project admins can write them. Copy from project brings another project's whole configuration over in one step: every panel, every widget, every rule, the project settings. Custom field ids are site-wide, so copied widgets keep their fields. And there are templates per core type — Epic Overview, Story Panel, Task at a Glance, Bug Triage — filling both surfaces as a starting point, everything editable afterwards.
Two things worth knowing before you install
- Panels reads, never writes. Every query runs with the viewer's own Jira permissions — two people can legitimately see different numbers on the same panel — and nothing is written to any issue. Nothing leaves your Jira site.
- 500 issues per source, honestly. A widget reads up to 500 issues per source; past that it prints "based on the first 500 — this scope has more" in a muted line rather than a confident partial number. Narrow the source or add a filter.
Try it on an epic in your own project. Plugio Panels is on the Atlassian Marketplace, and the documentation covers setup — including the one wide-panel click people miss — and every widget.
Need the same numbers across a whole project, on a dashboard? That's Plugio Suite.